|
Summary for |
March
2008 |
|
Mean Max: |
11.3ºC |
(+0.3ºC) |
|
Mean Min: |
3.8ºC |
(+0.2ºC) |
|
Mean: |
7.5ºC |
(+0.2ºC) |
|
|
|
|
|
High Max: |
16.3ºC |
31st |
|
Low Max: |
7.8ºC |
18th |
|
High Min: |
10.1ºC |
2nd |
|
Low Min: |
-2.7ºC |
5th |
|
Mean Grass Min: |
0.2ºC |
|
|
Grass Min: |
-6.7ºC |
5th |
|
|
|
|
|
Rain Total (gauge): |
116.4 mm |
(181%) |
|
Rain Total (tipping bucket): |
88.8 mm |
(138%) |
|
Rain Days >0.2: |
19 Days |
|
|
Rain Days >1.0: |
16 Days |
|
|
Max 24 hrs: |
22.4 mm |
22nd |
|
Days without any rain: |
10 |
|
|
|
|
|
|
Air Frost: |
3 Days |
|
|
Ground Frost: |
15 Days |
|
|
Snow Falling: |
0 Days |
|
|
Snow (50%) @ 9am: |
0 Days |
|
|
Thunder Heard: |
2 Days |
|
|
Hail <5 mm: |
4 Days |
|
|
Hail >5 mm: |
0 Days |
|
|
Fog @ 9am: |
0 Days |
|
|
|
|
|
|
Total Monthly Sunshine: |
132h:25m |
|
|
Total Monthly Sunshine: |
131.8 Hours |
|
|
Most Sunshine in a Day: |
10h:48m |
30th |
|
Average Daily Sunshine: |
04h:16m |
|
|
Sunless Days: |
3 Days |
|
|
Cloudless Days: |
0 Days |
|
|
Total Possible Sunshine: |
369h:54m |
|
|
Percentage of Total Sun: |
36% |
|
|
|
|
|
|
Mean Soil Temp @ 30 cm: |
7.3ºC |
|
|
Min Soil Temp @ 30 cm: |
5.8ºC |
23rd |
|
Max Soil Temp @ 30 cm: |
8.8ºC |
2nd |
|
Mean Soil Temp @ 100 cm: |
3.2ºC |
|
|
Min Soil Temp @ 100 cm: |
7.7ºC |
12th |
|
Max Soil Temp @ 100 cm: |
8.0ºC |
2nd |
|
|
|
|
|
Wind >39 mph: |
0.0 Days |
|
|
N: |
3.59 Days |
|
|
NE: |
1.21 Days |
|
|
E: |
0.61 Days |
|
|
SE: |
1.98 Days |
|
|
S: |
3.34 Days |
|
|
SW: |
3.83 Days |
|
|
W: |
9.75 Days |
|
|
NW: |
5.35 Days |
|
|
Calm: |
3.33 Days |
|
|
Mean Wind: |
6.3 mph |
|
|
Max Gust: |
58 mph |
10th |
|
|
|
|
|
Mean Cloud Cover: |
60% |
|
|
Mean RH @ 9am: |
80% |
|
|
Rain Duration >0.1mm/hour: |
55.3 Hours |
|
|
Frost Duration: |
19.8 Hours |
|
|
Max Frost Duration in a Day: |
7.5 Hours |
23rd |
|
|
|
|
|
Mean Sea Temperature: |
9.2ºC |
|
|
Normal for Month: |
|
|
|
Max Sea Temperature: |
11.0ºC |
31st |
|
Min Sea Temperature: |
8.8ºC |
23rd |
|
|
|
|
|
Mean Pressure @ 9am: |
1008.8 hPa |
|
|
Mean Pressure: |
1008.0 hPa |
(-6.5 hPa) |
|
Max Pressure: |
1036.8 hPa |
5th |
|
Min Pressure: |
961.1 hPa |
10th |
|
|
|
|
|
Max Dewpoint: |
9.8ºC |
11th |
|
Min Dewpoint: |
-5.5ºC |
5th |
|
Mean Dewpoint: |
2.8ºC |
|
|
|
|
|
|
Max Humidity: |
87% |
16th |
|
Min Humidity: |
43% |
22nd |
|
Mean Humidity: |
74% |
(-7) |
|
|
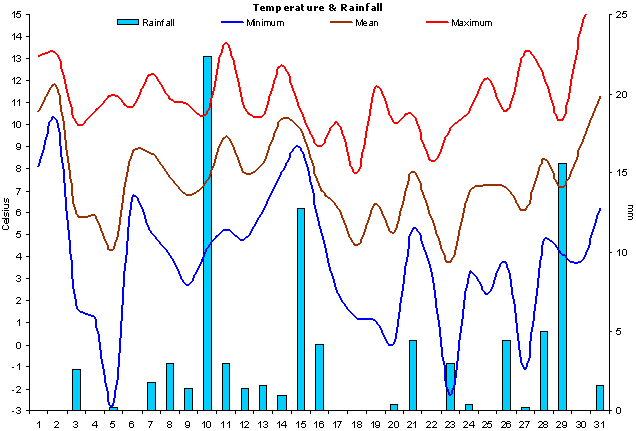
March started generally
sunny and warm, and ended that way too but for the
majority of the month it was cool and unsettled with the
3rd week being especially cold and wet. |
|
Rainfall was way above
average with 181% of the normal. Rain fell on 21 out of
the 31 days in the month. |
|
There was no snow lying or
falling at any point in the month, but there were 4
notable hailstorms accompanied with thunder and
lightning on two occasions. |
|
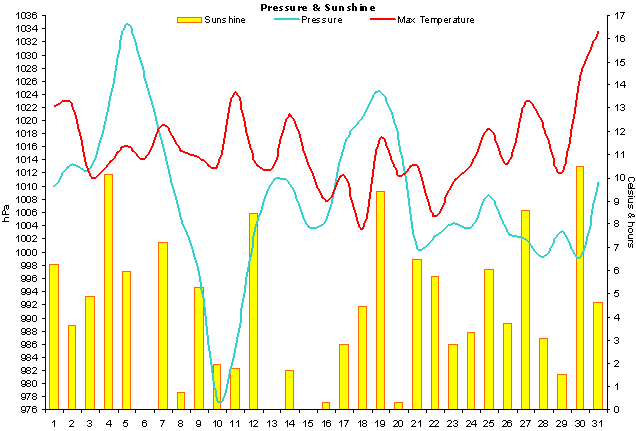
Sunshine levels were
slightly above normal but there were no days at all
during the month that were cloud-free. This month
actually had less sunshine than February. |
|
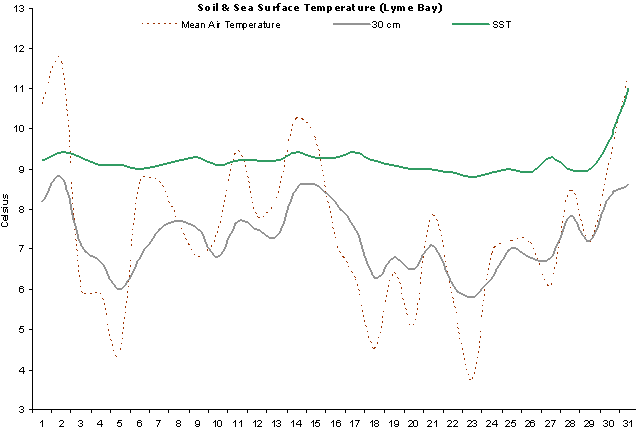
Soil temperatures remained
relatively constant throughout the month and were
above normal. |
|
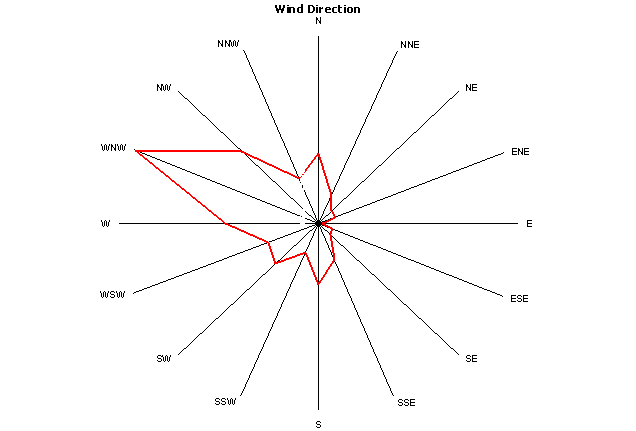
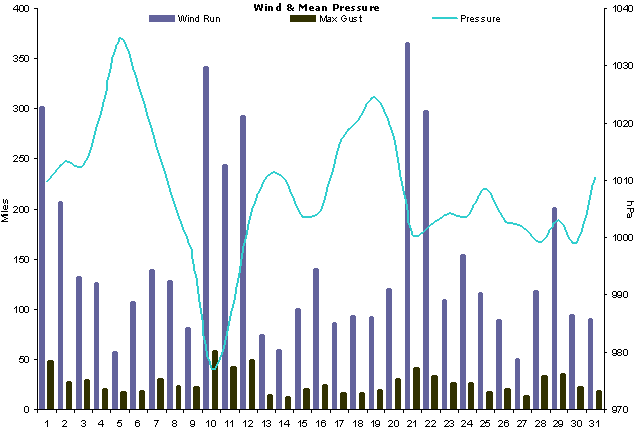
The month started windy,
carried on being windy and ended windy. In fact, it was
windy all the time. |
|
3 air frosts of which none
were severe and there were 15 ground frosts. |
|
Sea temperatures remained
just above normal throughout the month. |
|
Mean pressure was was 6.5
hPa below normal and indicative of the unsettled,
cyclonic nature of this month. |
|
Dewpoints were typically
variable for this time of year with the sea being at its
coldest. |
|
With a relative humidity
of 74%, this was 7 percentage points below normal. |
|
|
|
Daily Weather Data for Otter Valley, Devon. |
March 2008 |
|
|
|
Temp (oC) |
Hum (RH%) |
Dewpoint (oC) |
Wind (mph) |
Rain |
Pressure (hPa) |
Grass |
Sun |
|
|
|
Min |
Max |
Ave |
Min |
Max |
Ave |
Min |
Max |
Ave |
Max |
Ave |
Run |
mm |
Min |
Max |
Ave |
Min |
Hours |
Observations |
|
1 |
8.1 |
13.1 |
10.6 |
60 |
85 |
73 |
3.2 |
8.5 |
5.9 |
48 |
12.5 |
301 |
0.0 |
1004 |
1016 |
1010 |
5.4 |
6.3 |
Sunny intervals all day |
|
2 |
10.1 |
13.2 |
11.7 |
56 |
85 |
71 |
3.2 |
9.0 |
6.1 |
28 |
8.6 |
207 |
0.0 |
1012 |
1014 |
1013 |
6.8 |
3.6 |
Sunny intervals all day |
|
3 |
1.8 |
10.1 |
6.0 |
56 |
84 |
70 |
-2.1 |
4.4 |
1.2 |
29 |
5.5 |
132 |
2.6 |
1010 |
1016 |
1013 |
-2.8 |
4.9 |
Sunny then hail showers |
|
4 |
1.2 |
10.6 |
5.9 |
51 |
85 |
68 |
-2.8 |
2.4 |
-0.2 |
21 |
5.3 |
126 |
0.0 |
1010 |
1034 |
1022 |
-3.9 |
10.1 |
Sunny intervals all day |
|
5 |
-2.7 |
11.4 |
4.4 |
63 |
85 |
74 |
-5.5 |
5.8 |
0.2 |
17 |
2.4 |
57 |
0.2 |
1033 |
1037 |
1035 |
-6.7 |
6.0 |
Sunny am, cloudy pm |
|
6 |
6.6 |
10.8 |
8.7 |
72 |
83 |
78 |
2.8 |
5.9 |
4.4 |
18 |
4.4 |
107 |
0.0 |
1021 |
1033 |
1027 |
3.7 |
0.0 |
Cloudy all day |
|
7 |
5.1 |
12.3 |
8.7 |
54 |
85 |
70 |
0.4 |
5.3 |
2.9 |
30 |
5.8 |
139 |
1.8 |
1011 |
1020 |
1016 |
0.3 |
7.2 |
Sunny intervals all day |
|
8 |
4.1 |
11.2 |
7.7 |
78 |
86 |
82 |
0.7 |
7.3 |
4.0 |
23 |
5.3 |
128 |
3.0 |
998 |
1013 |
1006 |
0.7 |
0.8 |
Sunny int am, drizzle pm |
|
9 |
2.7 |
10.9 |
6.8 |
69 |
86 |
78 |
-1.2 |
6.1 |
2.5 |
22 |
3.4 |
81 |
1.4 |
994 |
999 |
996 |
-0.1 |
5.3 |
Sun & showers all day |
|
10 |
4.3 |
10.5 |
7.4 |
71 |
86 |
79 |
0.2 |
5.7 |
3.0 |
58 |
14.2 |
341 |
22.4 |
961 |
994 |
977 |
0.4 |
2.0 |
Sun & showers all day |
|
11 |
5.2 |
13.7 |
9.5 |
70 |
86 |
78 |
1.5 |
9.8 |
5.7 |
42 |
10.1 |
243 |
3.0 |
979 |
992 |
985 |
2.5 |
1.8 |
Sun & showers all day |
|
12 |
4.8 |
10.8 |
7.8 |
51 |
82 |
67 |
-0.1 |
5.8 |
2.9 |
49 |
12.2 |
293 |
1.4 |
992 |
1013 |
1002 |
1.7 |
8.5 |
Sunny intervals all day |
|
13 |
6.1 |
10.4 |
8.3 |
81 |
86 |
84 |
2.3 |
7.5 |
4.9 |
15 |
3.1 |
75 |
1.6 |
1007 |
1014 |
1011 |
1.4 |
0.0 |
Cloudy, int light rain |
|
14 |
7.8 |
12.7 |
10.3 |
83 |
86 |
85 |
5.2 |
9.2 |
7.2 |
12 |
2.5 |
59 |
1.0 |
1009 |
1012 |
1010 |
5.6 |
1.7 |
Sunny intervals all day |
|
15 |
8.9 |
10.6 |
9.8 |
84 |
86 |
85 |
6.2 |
7.5 |
6.9 |
20 |
4.2 |
100 |
12.8 |
997 |
1011 |
1004 |
5.7 |
0.0 |
Rain intermittent all day |
|
16 |
5.4 |
9.0 |
7.2 |
77 |
87 |
82 |
1.7 |
6.4 |
4.1 |
24 |
5.8 |
140 |
4.2 |
996 |
1014 |
1005 |
5.6 |
0.3 |
Light rain am, bright pm |
|
17 |
2.4 |
10.1 |
6.3 |
59 |
84 |
72 |
-1.5 |
3.6 |
1.1 |
16 |
3.6 |
86 |
0.0 |
1014 |
1019 |
1016 |
-0.4 |
2.8 |
Sunny intervals all day |
|
18 |
1.2 |
7.8 |
4.5 |
56 |
85 |
71 |
-3.2 |
0.2 |
-1.5 |
16 |
3.9 |
93 |
0.0 |
1018 |
1023 |
1021 |
-2.3 |
4.4 |
Sunny intervals all day |
|
19 |
1.1 |
11.7 |
6.4 |
48 |
84 |
66 |
-3.0 |
2.3 |
-0.4 |
19 |
3.8 |
92 |
0.0 |
1023 |
1026 |
1024 |
-3.4 |
9.5 |
Sunny intervals all day |
|
20 |
0.1 |
10.1 |
5.1 |
73 |
86 |
80 |
-2.8 |
6.5 |
1.9 |
30 |
5.0 |
120 |
0.4 |
1008 |
1027 |
1017 |
-3.6 |
0.3 |
Sunny int am, rain pm |
|
21 |
5.2 |
10.5 |
7.9 |
66 |
85 |
76 |
0.2 |
7.3 |
3.8 |
41 |
15.2 |
366 |
4.4 |
994 |
1007 |
1001 |
2.5 |
6.5 |
Sunshine & showers |
|
22 |
3.1 |
8.3 |
5.7 |
43 |
81 |
62 |
-3.7 |
0.1 |
-1.8 |
33 |
12.4 |
298 |
0.0 |
995 |
1010 |
1002 |
-0.8 |
5.7 |
Sunny intervals all day |
|
23 |
-2.3 |
9.8 |
3.8 |
66 |
86 |
76 |
-5.3 |
4.6 |
-0.4 |
26 |
4.5 |
109 |
3.0 |
999 |
1010 |
1004 |
-5.8 |
2.9 |
Sun & showers all day |
|
24 |
3.2 |
10.6 |
6.9 |
63 |
84 |
74 |
-0.8 |
4.2 |
1.7 |
27 |
6.4 |
154 |
0.4 |
1001 |
1006 |
1004 |
0.2 |
3.3 |
Sunny intervals all day |
|
25 |
2.3 |
12.1 |
7.2 |
50 |
80 |
65 |
-2.4 |
2.9 |
0.3 |
17 |
4.8 |
116 |
0.0 |
1006 |
1011 |
1009 |
-2.8 |
6.1 |
Sunny intervals all day |
|
26 |
3.7 |
10.6 |
7.2 |
65 |
85 |
75 |
-0.5 |
6.2 |
2.9 |
21 |
3.7 |
89 |
4.4 |
1000 |
1007 |
1003 |
-1.9 |
3.7 |
Rain am, sunny int pm |
|
27 |
-1.1 |
13.3 |
6.1 |
54 |
86 |
70 |
-3.8 |
4.6 |
0.4 |
14 |
2.4 |
50 |
0.2 |
999 |
1005 |
1002 |
-4.4 |
8.6 |
Sunny intervals all day |
|
28 |
4.7 |
12.2 |
8.5 |
57 |
85 |
71 |
0.6 |
8.2 |
4.4 |
33 |
9.2 |
118 |
5.0 |
993 |
1006 |
999 |
0.4 |
3.0 |
Rain am, sunny int pm |
|
29 |
4.1 |
10.2 |
7.2 |
77 |
86 |
82 |
0.6 |
6.6 |
3.6 |
35 |
8.4 |
201 |
15.6 |
997 |
1010 |
1003 |
-1.1 |
1.5 |
Sunny int early am, then rain |
|
30 |
3.8 |
14.4 |
9.1 |
52 |
86 |
69 |
0.5 |
6.5 |
3.5 |
22 |
3.9 |
94 |
0.0 |
996 |
1003 |
999 |
-0.1 |
10.5 |
Sunny intervals all day |
|
31 |
6.2 |
16.3 |
11.3 |
61 |
85 |
73 |
3.4 |
9.1 |
6.3 |
18 |
3.7 |
90 |
1.6 |
1002 |
1019 |
1011 |
3.4 |
4.6 |
Sunny intervals all day |
|
|
3.8 |
11.3 |
7.5 |
63 |
85 |
74 |
-0.2 |
5.8 |
2.8 |
27 |
6.3 |
4601 |
88.8 |
1002 |
1013 |
1008 |
0.2 |
131.8 |
|
|
|
Graphs for
March 2008 |
|
|
Figure 1. Temperature and
Rainfall for March 2008. |
 |
|
Figure 2. Sunshine, air
pressure and mean wind speed for March 2008. |
 |
|
Figure 3.
Wind direction for March 2008. |
 |
|
Figure 4. Sea Surface
Temperature (SST) for Lyme Bay for March 2008. |
 |
|
Figure 5. Wind and mean
pressure for March 2008. |
| |