|
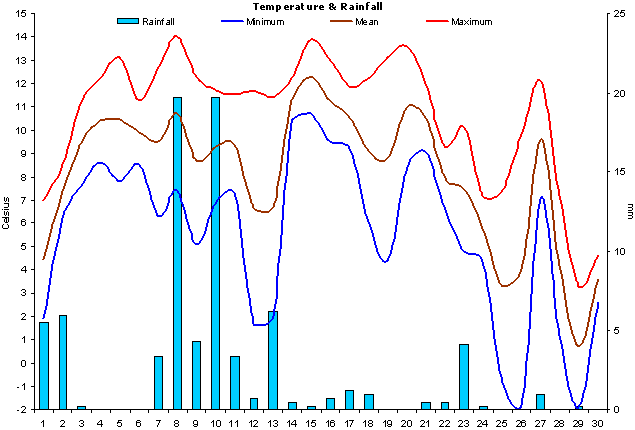
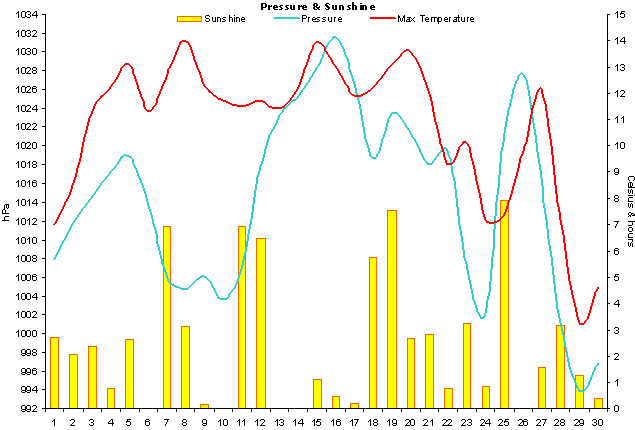
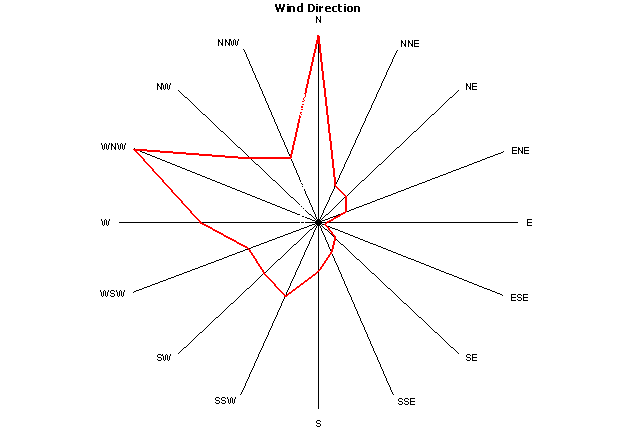
Summary for |
November 2008 |
|
Mean Max: |
10.7ºC |
(-0.7ºC) |
|
Mean Min: |
5.6ºC |
(+0.6ºC) |
|
Mean: |
8.1ºC |
(-0.1ºC) |
|
|
|
|
|
High Max: |
14.0ºC |
8th |
|
Low Max: |
3.3ºC |
29th |
|
High Min: |
10.7ºC |
15th |
|
Low Min: |
-1.9ºC |
29th |
|
Mean Grass Min: |
3.0ºC |
|
|
Grass Min: |
-4.0ºC |
29th |
|
|
|
|
|
Rain Total (gauge): |
79.2 mm |
(127%) |
|
Rain Total (tipping bucket): |
79.1 mm |
(127%) |
|
Rain Days >0.2 mm: |
21 Days |
|
|
Rain Days >1.0 mm: |
10 Days |
|
|
Max 24 hrs: |
19.7 mm |
8th |
|
Days without any rain: |
9 |
|
|
|
|
|
|
Air Frost: |
3 Days |
|
|
Ground Frost: |
7 Days |
|
|
Snow Falling: |
0 Days |
|
|
Snow (50%) @ 9am: |
0 Days |
|
|
Thunder Heard: |
0 Days |
|
|
Hail <5 mm: |
0 Days |
|
|
Hail >5 mm: |
0 Days |
|
|
Fog @ 9am: |
0 Days |
|
|
|
|
|
|
Total Monthly Sunshine: |
74h:16m |
|
|
Total Monthly Sunshine: |
74.0 Hours |
|
|
Most Sunshine in a Day: |
07h:55m |
25th |
|
Average Daily Sunshine: |
02h:28m |
|
|
Sunless Days: |
5 Days |
|
|
Cloudless Days: |
1 Days |
|
|
Total Possible Sunshine: |
268h:41m |
|
|
Percentage of Total Sun: |
28% |
|
|
|
|
|
|
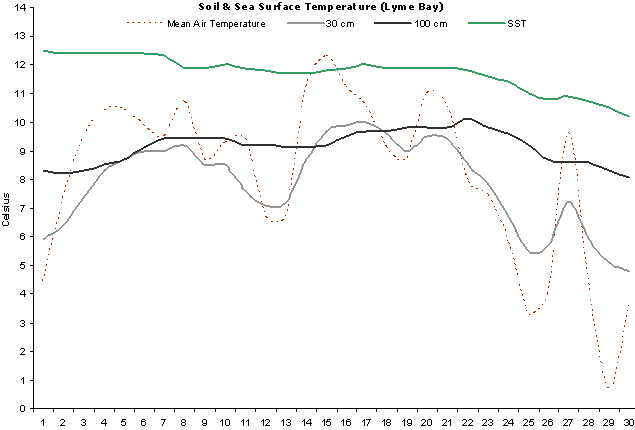
Mean Soil Temp @ 30 cm: |
7.9ºC |
|
|
Min Soil Temp @ 30 cm: |
4.8ºC |
30th |
|
Max Soil Temp @ 30 cm: |
10.0ºC |
17th |
|
Mean Soil Temp @ 100 cm: |
9.1ºC |
|
|
Min Soil Temp @ 100 cm: |
8.1ºC |
30th |
|
Max Soil Temp @ 100 cm: |
10.1ºC |
22nd |
|
|
|
|
|
Mean 10 Min Wind >39 mph: |
0.1 Days |
|
|
N: |
5.80 Days |
|
|
NE: |
1.65 Days |
|
|
E: |
0.42 Days |
|
|
SE: |
1.40 Days |
|
|
S: |
3.31 Days |
|
|
SW: |
3.66 Days |
|
|
W: |
7.60 Days |
|
|
NW: |
4.04 Days |
|
|
Calm: |
2.13 Days |
|
|
Mean Wind: |
4.9 mph |
|
|
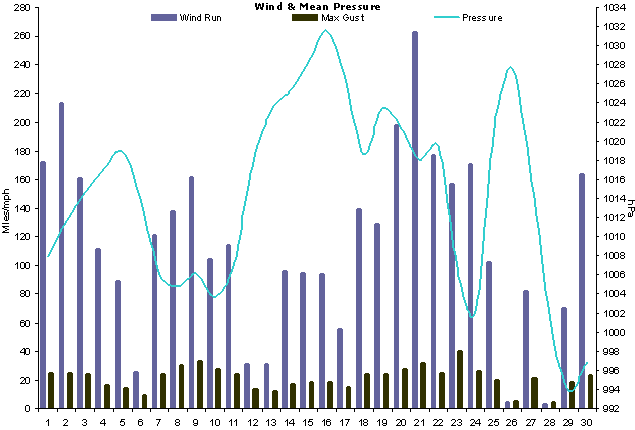
Max Gust: |
40 mph |
23rd |
|
|
|
|
|
Mean Cloud Cover: |
64% |
|
|
Mean RH @ 9am: |
87% |
|
|
Rain Duration >0.1mm/hour: |
40.3 Hours |
|
|
Frost Duration: |
16.0 Hours |
|
|
Max Frost Duration in a Day: |
7.5 Hours |
29th |
|
|
|
|
|
Mean Sea Temperature: |
11.7ºC |
|
|
Normal for Month: |
|
|
|
Max Sea Temperature: |
12.5ºC |
1st |
|
Min Sea Temperature: |
10.2ºC |
30th |
|
|
|
|
|
Mean Pressure @ 9am: |
1016.4 hPa |
(+0.7 hPa) |
|
Mean Pressure: |
1014.3 hPa |
(-1.4 hPa) |
|
Max Pressure: |
1034.4 hPa |
17th |
|
Min Pressure: |
990.7 hPa |
24th |
|
|
|
|
|
Max Dewpoint: |
11.2ºC |
15th |
|
Min Dewpoint: |
-4.2ºC |
26th |
|
Mean Dewpoint: |
5.1ºC |
|
|
|
|
|
|
Max Humidity: |
93% |
13th |
|
Min Humidity: |
63% |
25th |
|
Mean Humidity: |
83% |
(-3) |
|
|
Cool and wet to start
but soon became much warmer and the warmth lasted until
the final week of the month when there were a few air
frosts at night. A little wetter than normal and
sunshine levels were just a little below average. Quite
dull around mid-month but the 3rd week was sunny and
settled.
Apart from the first few
days and the last week, the temperatures were generally above
the long-term average for the majority of the month. The
cold start and end dragged the mean temperature down considerably
but despite this the month ended up around average
temperature-wise. |
|
The majority of the
rainfall fell in the first two weeks, after that the
rainfall still remained frequent but was very light. |
|
The first air frost of the
month occurred on the 26th. |
|
Sunshine levels were just
slightly less than average.. |
|
Soil temperatures
recovered slightly after the now infamous 'Great Ottery
Hailstorm' in October, then started to fall again during
the last week of the month. |
|
Winds dominated from the
north and north-west sectors. Despite this the month was
not cold overall with temperatures around or just
slightly below average. |
|
There were 3 air frosts
which amounted to a total time of 16 hours with
temperatures below 0°C. |
|
Sea temperatures fell
gradually throughout the month and on the whole were
around average or slightly below average, especially at
the end of the month. |
|
Mean pressure was 0.3 hPa
above normal. |
|
Dewpoints were significantly
low at times during the final week of the month as dry,
cold air fed down from the north. |
|
This cold, Arctic air at
the end to the month meant relative humidity ended up
being below normal. |
|
|
|
|
|
Weather Data for Otter Valley, Devon. |
November 2008 |
|
|
|
Temp (oC) |
Hum (RH%) |
Dewpoint (oC) |
Wind (mph) |
Rain |
Pressure (hPa) |
Grass |
Sun |
|
|
|
Min |
Max |
Ave |
Min |
Max |
Ave |
Min |
Max |
Ave |
Max |
Ave |
Run |
mm |
Min |
Max |
Ave |
Min |
Hours |
Observations |
|
1 |
1.9 |
7.0 |
4.5 |
80 |
89 |
85 |
-0.4 |
4.7 |
2.2 |
25 |
7.2 |
172 |
4.6 |
1006 |
1010 |
1008 |
0.3 |
2.7 |
Brief sunny ints am, rain pm |
|
2 |
6.2 |
8.5 |
7.4 |
82 |
89 |
86 |
3.9 |
5.5 |
4.7 |
25 |
8.9 |
213 |
5.4 |
1007 |
1016 |
1012 |
5.1 |
2.1 |
Cloudy am, sunny ints pm |
|
3 |
7.7 |
11.3 |
9.5 |
77 |
88 |
83 |
4.9 |
7.6 |
6.3 |
24 |
6.7 |
161 |
0.2 |
1013 |
1016 |
1015 |
6.2 |
2.4 |
Sunny intervals all day |
|
4 |
8.6 |
12.2 |
10.4 |
79 |
90 |
85 |
6.0 |
8.9 |
7.5 |
16 |
4.6 |
111 |
0.0 |
1016 |
1019 |
1017 |
5.6 |
0.8 |
Cloudy am, sunny ints pm |
|
5 |
7.8 |
13.1 |
10.5 |
73 |
89 |
81 |
5.3 |
9.2 |
7.3 |
14 |
3.7 |
89 |
0.0 |
1018 |
1019 |
1019 |
4.4 |
2.6 |
Sunny intervals all day |
|
6 |
8.5 |
11.3 |
9.9 |
82 |
89 |
86 |
5.7 |
8.2 |
7.0 |
9 |
1.1 |
25 |
0.0 |
1009 |
1019 |
1014 |
5.7 |
0.0 |
Cloudy all day |
|
7 |
6.3 |
12.7 |
9.5 |
64 |
90 |
77 |
3.2 |
9.2 |
6.2 |
24 |
5.0 |
121 |
2.8 |
1003 |
1009 |
1006 |
3.4 |
6.9 |
Sunny intervals all day |
|
8 |
7.4 |
14.0 |
10.7 |
74 |
92 |
83 |
3.3 |
10.5 |
6.9 |
30 |
7.0 |
137 |
16.4 |
1000 |
1009 |
1005 |
3.4 |
3.1 |
Sunny intervals all day |
|
9 |
5.1 |
12.3 |
8.7 |
75 |
89 |
82 |
2.3 |
9.6 |
6.0 |
33 |
7.3 |
161 |
3.6 |
1002 |
1011 |
1006 |
3.4 |
0.2 |
Showers, brief sunny ints |
|
10 |
6.9 |
11.7 |
9.3 |
75 |
91 |
83 |
4.2 |
8.3 |
6.3 |
28 |
4.3 |
104 |
16.4 |
1000 |
1007 |
1004 |
5.4 |
0.0 |
Heavy rain am, cloudy pm |
|
11 |
7.3 |
11.5 |
9.4 |
66 |
88 |
77 |
3.3 |
6.5 |
4.9 |
24 |
4.8 |
114 |
2.8 |
1001 |
1013 |
1007 |
1.0 |
6.9 |
Sunshine & showers |
|
12 |
1.7 |
11.7 |
6.7 |
73 |
92 |
83 |
-0.7 |
8.6 |
4.0 |
13 |
1.3 |
31 |
0.6 |
1013 |
1023 |
1018 |
-0.9 |
6.5 |
Sunny intervals all day |
|
13 |
2.0 |
11.4 |
6.7 |
85 |
93 |
89 |
-0.1 |
9.7 |
4.8 |
12 |
1.3 |
31 |
5.2 |
1022 |
1024 |
1023 |
-0.4 |
0.0 |
Rain all day |
|
14 |
10.3 |
12.2 |
11.3 |
83 |
93 |
88 |
8.3 |
10.0 |
9.2 |
17 |
4.0 |
96 |
0.4 |
1023 |
1027 |
1025 |
7.8 |
0.0 |
Cloudy all day |
|
15 |
10.7 |
13.9 |
12.3 |
83 |
91 |
87 |
8.2 |
11.2 |
9.7 |
18 |
3.9 |
94 |
0.2 |
1027 |
1030 |
1028 |
8.8 |
1.1 |
Brief sunny intervals all day |
|
16 |
9.5 |
13.0 |
11.3 |
87 |
91 |
89 |
7.4 |
10.5 |
9.0 |
19 |
3.9 |
93 |
0.6 |
1030 |
1033 |
1032 |
8.7 |
0.5 |
Brief sunny intervals all day |
|
17 |
9.2 |
11.9 |
10.6 |
80 |
92 |
86 |
7.3 |
9.7 |
8.5 |
15 |
2.3 |
56 |
1.0 |
1019 |
1034 |
1027 |
7.1 |
0.2 |
Drizzle am, sunny ints pm |
|
18 |
6.1 |
12.2 |
9.2 |
73 |
91 |
82 |
4.7 |
9.0 |
6.9 |
24 |
5.8 |
139 |
0.8 |
1014 |
1024 |
1019 |
4.6 |
5.8 |
Sunny intervals all day |
|
19 |
4.4 |
13.1 |
8.8 |
66 |
91 |
79 |
2.4 |
8.8 |
5.6 |
24 |
5.4 |
129 |
0.0 |
1022 |
1025 |
1023 |
2.0 |
7.5 |
Sunny intervals all day |
|
20 |
8.4 |
13.6 |
11.0 |
76 |
90 |
83 |
5.3 |
9.9 |
7.6 |
28 |
8.2 |
198 |
0.0 |
1020 |
1023 |
1021 |
5.1 |
2.7 |
Sunny intervals all day |
|
21 |
9.1 |
12.0 |
10.6 |
67 |
90 |
79 |
3.1 |
9.8 |
6.5 |
32 |
10.9 |
263 |
0.4 |
1016 |
1020 |
1018 |
5.4 |
2.8 |
Sunny intervals all day |
|
22 |
6.6 |
9.3 |
8.0 |
71 |
83 |
77 |
2.4 |
5.1 |
3.8 |
25 |
7.4 |
177 |
0.4 |
1018 |
1021 |
1020 |
3.7 |
0.8 |
Sunny intervals all day |
|
23 |
4.8 |
10.1 |
7.5 |
68 |
91 |
80 |
1.5 |
8.1 |
4.8 |
40 |
6.5 |
156 |
3.4 |
995 |
1019 |
1007 |
3.5 |
3.3 |
Rain then sun & showers |
|
24 |
4.4 |
7.2 |
5.8 |
66 |
87 |
77 |
-0.7 |
2.7 |
1.0 |
26 |
7.1 |
171 |
0.2 |
991 |
1014 |
1002 |
-0.8 |
0.9 |
Sunny intervals all day |
|
25 |
-0.8 |
7.4 |
3.3 |
63 |
87 |
75 |
-3.7 |
2.1 |
-0.8 |
20 |
4.3 |
102 |
0.0 |
1014 |
1029 |
1021 |
-3.4 |
7.9 |
Sunny all day |
|
26 |
-1.8 |
9.8 |
4.0 |
78 |
90 |
84 |
-4.2 |
7.6 |
1.7 |
5 |
0.2 |
4 |
0.0 |
1025 |
1030 |
1028 |
-3.9 |
0.0 |
Cloudy all day |
|
27 |
7.1 |
12.1 |
9.6 |
71 |
90 |
81 |
4.7 |
8.0 |
6.4 |
21 |
3.4 |
82 |
0.8 |
1007 |
1025 |
1016 |
2.6 |
1.6 |
Sunshine & showers |
|
28 |
1.2 |
7.2 |
4.2 |
81 |
91 |
86 |
-1.3 |
4.9 |
1.8 |
4 |
0.1 |
3 |
0.0 |
996 |
1007 |
1001 |
-1.1 |
3.2 |
Sunny intervals all day |
|
29 |
-1.9 |
3.3 |
0.7 |
85 |
90 |
88 |
-3.8 |
0.8 |
-1.5 |
18 |
2.9 |
70 |
0.2 |
992 |
996 |
994 |
-4.0 |
1.3 |
Brief sunny intervals all day |
|
30 |
2.6 |
4.6 |
3.6 |
75 |
87 |
81 |
-1.6 |
0.7 |
-0.5 |
23 |
6.8 |
164 |
0.0 |
993 |
1000 |
997 |
1.8 |
0.4 |
Brief sunny intervals all day |
|
|
5.6 |
10.7 |
8.1 |
75 |
90 |
83 |
2.7 |
7.5 |
5.1 |
21 |
4.9 |
3465 |
66.4 |
1010 |
1018 |
1014 |
3.0 |
74.0 |
|
Graphs for
November 2008 |
 |
|
Figure 1. Temperature and
Rainfall for November 2008. |
 |
|
Figure 2. Sunshine, air
pressure and mean wind speed for November 2008. |
 |
|
Figure 3.
Wind direction for November 2008. |
 |
|
Figure 4. Soil & sea surface
temperature (SST) for Lyme Bay for November 2008. |
 |
|
Figure 5.
Wind run, maximum
gusts and mean
pressure for November 2008. |
| |