|
Summary for |
September
2009 |
|
Mean Max: |
19.5ºC |
(+1.0ºC) |
|
Mean Min: |
10.4ºC |
(+0.4ºC) |
|
Mean: |
15.0ºC |
(+0.7ºC) |
|
|
|
|
|
High Max: |
22.7ºC |
12th |
|
Low Max: |
16.2ºC |
3rd |
|
High Min: |
16.6ºC |
8th |
|
Low Min: |
4.7ºC |
25th |
|
Mean Grass Min: |
8.8ºC |
|
|
Grass Min: |
3.2ºC |
25th |
|
|
|
|
|
Rain Total (gauge): |
26.4 mm |
(75%) |
|
Rain Total (tipping bucket): |
27.9 mm |
(79%) |
|
Rain Days >0.2 mm: |
3 Days |
|
|
Rain Days >1.0 mm: |
3 Days |
|
|
Max 24 hrs: |
16.1 mm |
2nd |
|
Days without any rain: |
27 |
|
|
|
|
|
|
Air Frost: |
0 Days |
|
|
Ground Frost: |
0 Days |
|
|
Snow Falling: |
0 Days |
|
|
Snow (50%) @ 9am: |
0 Days |
|
|
Thunder Heard: |
0 Days |
|
|
Hail <5 mm: |
0 Days |
|
|
Hail >5 mm: |
0 Days |
|
|
Fog @ 9am: |
0 Days |
|
|
|
|
|
|
Total Monthly Sunshine: |
184h:36m |
|
|
Total Monthly Sunshine: |
184.6 Hours |
|
|
Most Sunshine in a Day: |
12h:26m |
10th |
|
Average Daily Sunshine: |
06h:09m |
|
|
Sunless Days: |
0 Days |
|
|
Cloudless Days: |
5 Days |
|
|
Total Possible Sunshine: |
378h:12m |
|
|
Percentage of Total Sun: |
49% |
|
|
|
|
|
|
Mean Soil Temp @ 30 cm: |
13.9ºC |
|
|
Min Soil Temp @ 30 cm: |
12.9ºC |
27th |
|
Max Soil Temp @ 30 cm: |
15.1ºC |
1st |
|
Mean Soil Temp @ 100 cm: |
14.5ºC |
|
|
Min Soil Temp @ 100 cm: |
13.9ºC |
30th |
|
Max Soil Temp @ 100 cm: |
15.2ºC |
1st |
|
|
|
|
|
Mean 10 Min Wind >39 mph: |
0.0 Days |
|
|
N: |
8.29 Days |
|
|
NE: |
2.78 Days |
|
|
E: |
0.20 Days |
|
|
SE: |
2.97 Days |
|
|
S: |
2.39 Days |
|
|
SW: |
2.56 Days |
|
|
W: |
3.77 Days |
|
|
NW: |
3.21 Days |
|
|
Calm: |
4.83 Days |
|
|
Mean Wind: |
3.2 mph |
|
|
Max Gust: |
31 mph |
2nd |
|
|
|
|
|
Mean Cloud Cover: |
56% |
|
|
Mean RH @ 9am: |
85% |
|
|
Rain Duration >0.1mm/hour: |
11.8 Hours |
|
|
Frost Duration: |
0.0 Hours |
|
|
Max Frost Duration in a Day: |
0.0 Hours |
|
|
|
|
|
|
Mean Sea Temperature: |
16.6ºC |
|
|
Normal for Month: |
|
|
|
Max Sea Temperature: |
17.3ºC |
1st |
|
Min Sea Temperature: |
16.2ºC |
18th |
|
|
|
|
|
Mean Pressure @ 9am: |
1022.9 hPa |
(+6.4 hPa) |
|
Mean Pressure: |
1022.1 hPa |
(+5.6 hPa) |
|
Max Pressure: |
1037.1 hPa |
11th |
|
Min Pressure: |
995.2 hPa |
3rd |
|
|
|
|
|
Max Dewpoint: |
16.8ºC |
7th |
|
Min Dewpoint: |
5.3ºC |
10th |
|
Mean Dewpoint: |
10.1ºC |
|
|
|
|
|
|
Max Humidity: |
98% |
2nd |
|
Min Humidity: |
48% |
11th |
|
Mean Humidity: |
75% |
(-6) |
|
|
After
a
disappointing July & August, summer finally arrives in
September. Overall a dry, settled, warm and sunny month.
Overall
temperatures were above the LTA though there were no
really warm days, but no cold ones either. |
|
There was no measurable rainfall
from the 5th to the 30th. |
|
Unusually
for September there were no thunderstorms. |
|
A
generally sunny month though there was quite a lot of
cloud on some days. |
|
Soil temperatures
were normal throughout. |
|
Winds were dominant from
a northerly direction, though they were mainly light,
especially after mid-month. |
|
There were 5 days of unbroken sunshine. |
|
Sea temperatures were at
their highest during the 1st week when there was a run
of warm nights. |
|
Mean pressure was 5.6 hPa
above normal and indicative of the very settled,
anticyclonic conditions prevalent from the 5th onwards. |
|
Dewpoints were quite high
at times. |
|
Overall though the RH was
rather below normal. |
|
|
|
|
Weather Data for Otter Valley, Devon. |
September 2009 |
|
|
|
Temp (oC) |
Hum (RH%) |
Dewpoint (oC) |
Wind (mph) |
Rain |
Pressure (hPa) |
Grass |
Sun |
|
|
|
Min |
Max |
Ave |
Min |
Max |
Ave |
Min |
Max |
Ave |
Max |
Ave |
Run |
mm |
Min |
Max |
Ave |
Min |
Hours |
Observations |
|
1 |
11.2 |
19.5 |
15.4 |
55 |
89 |
72 |
8.6 |
12.7 |
10.7 |
27 |
5.1 |
120 |
0.0 |
1004 |
1010 |
1007 |
11.2 |
9.2 |
Sunny intervals all day |
|
2 |
12.3 |
16.3 |
14.3 |
78 |
92 |
85 |
8.9 |
13.7 |
11.3 |
31 |
5.3 |
128 |
16.1 |
996 |
1011 |
1004 |
10.5 |
1.0 |
Bright am, rain pm |
|
3 |
11.8 |
16.2 |
14.0 |
67 |
90 |
79 |
8.4 |
12.6 |
10.5 |
29 |
7.5 |
180 |
1.7 |
995 |
1006 |
1000 |
10.2 |
6.7 |
Sunny ints am, showers pm |
|
4 |
9.9 |
16.4 |
13.2 |
67 |
91 |
79 |
7.8 |
10.6 |
9.2 |
30 |
5.7 |
136 |
10.0 |
1005 |
1018 |
1012 |
9.4 |
7.2 |
Sunny intervals all day |
|
5 |
8.7 |
16.2 |
12.5 |
71 |
91 |
81 |
6.2 |
11.7 |
9.0 |
18 |
2.2 |
54 |
0.0 |
1018 |
1025 |
1022 |
7.1 |
2.3 |
Sunny intervals all day |
|
6 |
12.1 |
18.6 |
15.4 |
68 |
87 |
78 |
8.8 |
12.7 |
10.8 |
20 |
3.8 |
91 |
0.0 |
1019 |
1025 |
1022 |
11.4 |
4.1 |
Sunny intervals all day |
|
7 |
14.7 |
22.6 |
18.7 |
71 |
90 |
81 |
11.7 |
16.8 |
14.3 |
15 |
3.8 |
91 |
0.0 |
1016 |
1019 |
1017 |
13.9 |
2.4 |
Sunny intervals all day |
|
8 |
16.6 |
20.1 |
18.4 |
81 |
92 |
87 |
13.1 |
16.5 |
14.8 |
19 |
4.1 |
99 |
0.0 |
1017 |
1020 |
1018 |
15.8 |
0.0 |
Brief sunny intervals |
|
9 |
12.7 |
21.1 |
16.9 |
50 |
87 |
69 |
8.4 |
13.0 |
10.7 |
19 |
4.3 |
103 |
0.0 |
1020 |
1031 |
1026 |
12.3 |
10.3 |
Sunny intervals all day |
|
10 |
7.7 |
21.1 |
14.4 |
49 |
85 |
67 |
5.3 |
11.1 |
8.2 |
20 |
4.7 |
112 |
0.0 |
1031 |
1036 |
1034 |
6.1 |
12.4 |
Sunny all day |
|
11 |
10.7 |
21.8 |
16.3 |
48 |
83 |
66 |
6.4 |
10.8 |
8.6 |
18 |
4.4 |
105 |
0.0 |
1033 |
1037 |
1035 |
10.0 |
12.4 |
Sunny all day |
|
12 |
9.7 |
22.7 |
16.2 |
54 |
88 |
71 |
6.5 |
13.3 |
9.9 |
17 |
2.6 |
61 |
0.0 |
1028 |
1033 |
1030 |
8.9 |
12.3 |
Sunny all day |
|
13 |
9.1 |
22.0 |
15.6 |
54 |
89 |
72 |
6.2 |
12.6 |
9.4 |
16 |
2.2 |
53 |
0.0 |
1026 |
1029 |
1028 |
8.1 |
10.0 |
Sunny intervals all day |
|
14 |
12.3 |
19.8 |
16.1 |
57 |
75 |
66 |
6.7 |
10.7 |
8.7 |
17 |
3.9 |
93 |
0.0 |
1025 |
1028 |
1026 |
11.0 |
5.4 |
Cloudy am, sunny pm |
|
15 |
11.3 |
17.8 |
14.6 |
68 |
84 |
76 |
7.7 |
11.3 |
9.5 |
25 |
7.0 |
168 |
0.0 |
1020 |
1025 |
1023 |
8.9 |
3.1 |
Sunny ints am, cloudy pm |
|
16 |
13.8 |
19.3 |
16.6 |
56 |
79 |
68 |
7.4 |
10.6 |
9.0 |
22 |
7.0 |
169 |
0.0 |
1021 |
1023 |
1022 |
10.5 |
8.8 |
Sunny intervals all day |
|
17 |
8.6 |
20.2 |
14.4 |
51 |
78 |
65 |
5.3 |
9.5 |
7.4 |
23 |
4.6 |
112 |
0.0 |
1020 |
1023 |
1021 |
5.7 |
11.4 |
Sunny all day |
|
18 |
8.4 |
16.5 |
12.5 |
70 |
87 |
79 |
5.8 |
11.6 |
8.7 |
10 |
1.0 |
25 |
0.0 |
1015 |
1021 |
1018 |
5.5 |
1.6 |
Sunny ints am, cloudy pm |
|
19 |
11.1 |
22.1 |
16.6 |
65 |
90 |
78 |
8.2 |
14.7 |
11.5 |
15 |
2.3 |
55 |
0.0 |
1015 |
1019 |
1017 |
8.9 |
7.8 |
Sunny intervals all day |
|
20 |
7.8 |
22.2 |
15.0 |
55 |
91 |
73 |
7.1 |
12.7 |
9.9 |
9 |
0.7 |
18 |
0.0 |
1019 |
1025 |
1022 |
6.0 |
6.6 |
Sunny intervals all day |
|
21 |
7.1 |
20.4 |
13.8 |
59 |
91 |
75 |
6.4 |
12.6 |
9.5 |
10 |
1.0 |
24 |
0.0 |
1025 |
1028 |
1026 |
5.5 |
7.2 |
Sunny intervals all day |
|
22 |
12.7 |
18.9 |
15.8 |
71 |
86 |
79 |
8.3 |
13.7 |
11.0 |
12 |
2.1 |
51 |
0.0 |
1025 |
1026 |
1025 |
8.9 |
1.2 |
Brief sunny intervals |
|
23 |
14.2 |
17.9 |
16.1 |
82 |
89 |
86 |
12.6 |
15.1 |
13.9 |
10 |
1.1 |
26 |
0.0 |
1025 |
1027 |
1026 |
14.1 |
1.2 |
Cloudy am, light drizzle pm |
|
24 |
7.1 |
19.5 |
13.3 |
58 |
92 |
75 |
6.0 |
12.5 |
9.3 |
12 |
1.9 |
41 |
0.0 |
1026 |
1028 |
1027 |
5.8 |
11.0 |
Sunny all day |
|
25 |
4.7 |
17.8 |
11.3 |
58 |
91 |
75 |
6.1 |
10.5 |
8.3 |
12 |
1.2 |
29 |
0.0 |
1027 |
1029 |
1028 |
3.4 |
7.1 |
Sunny intervals all day |
|
26 |
10.9 |
19.4 |
15.2 |
62 |
88 |
75 |
5.9 |
12.1 |
9.0 |
9 |
0.5 |
12 |
0.0 |
1026 |
1028 |
1027 |
7.1 |
2.7 |
Sunny intervals all day |
|
27 |
5.2 |
21.8 |
13.5 |
57 |
92 |
75 |
5.5 |
13.2 |
9.4 |
10 |
1.2 |
28 |
0.0 |
1027 |
1029 |
1028 |
4.5 |
10.3 |
Misty early am, then sunny |
|
28 |
7.8 |
17.3 |
12.6 |
72 |
91 |
82 |
6.4 |
12.5 |
9.5 |
13 |
1.7 |
42 |
0.0 |
1026 |
1029 |
1027 |
5.8 |
0.2 |
Brief sunny intervals |
|
29 |
8.7 |
20.2 |
14.5 |
64 |
91 |
78 |
6.2 |
13.1 |
9.7 |
15 |
1.9 |
47 |
0.0 |
1022 |
1027 |
1024 |
6.5 |
6.9 |
Sunny intervals all day |
|
30 |
13.3 |
19.2 |
16.3 |
60 |
84 |
72 |
9.7 |
12.0 |
10.9 |
8 |
0.6 |
15 |
0.0 |
1018 |
1023 |
1020 |
11.5 |
1.8 |
Sunny intervals all day |
|
|
10.4 |
19.5 |
15.0 |
63 |
88 |
75 |
7.6 |
12.6 |
10.1 |
17 |
3.2 |
2281 |
27.9 |
1020 |
1025 |
1022 |
8.8 |
184.6 |
|
|
|
Graphs for
September 2009 |
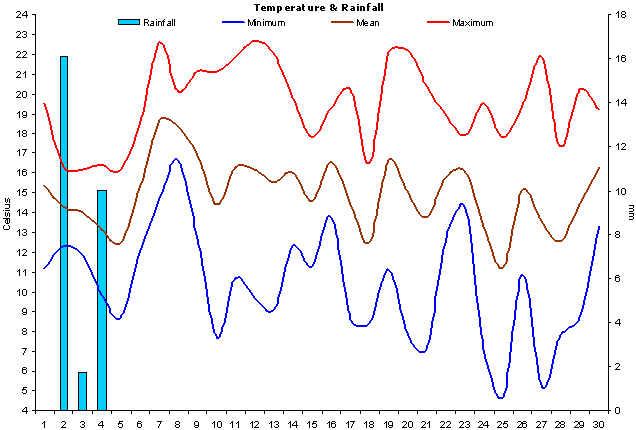 |
|
Figure 1. Temperature and
Rainfall for September 2009. |
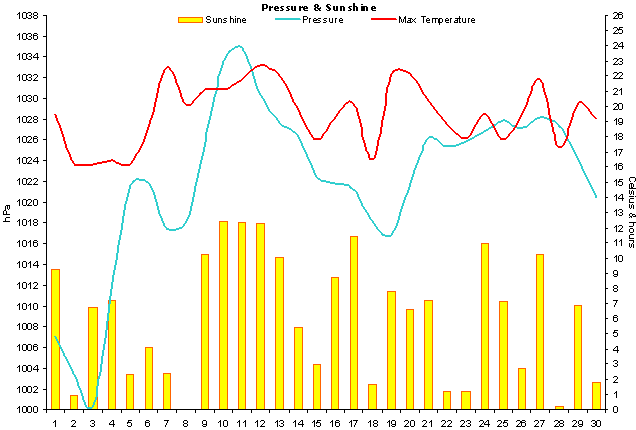 |
|
Figure 2. Sunshine, air
pressure and mean wind speed for September 2009. |
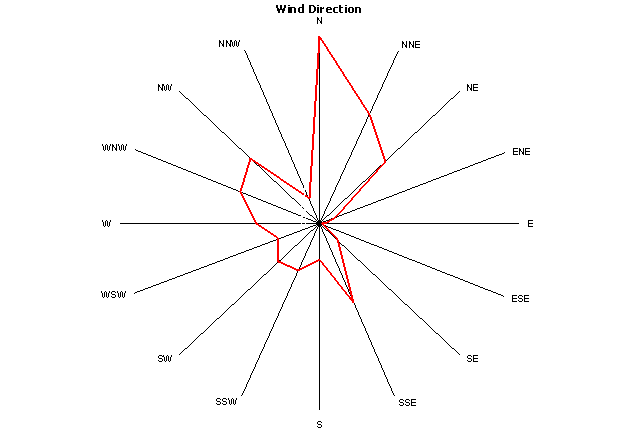 |
|
Figure 3.
Wind direction for September 2009. |
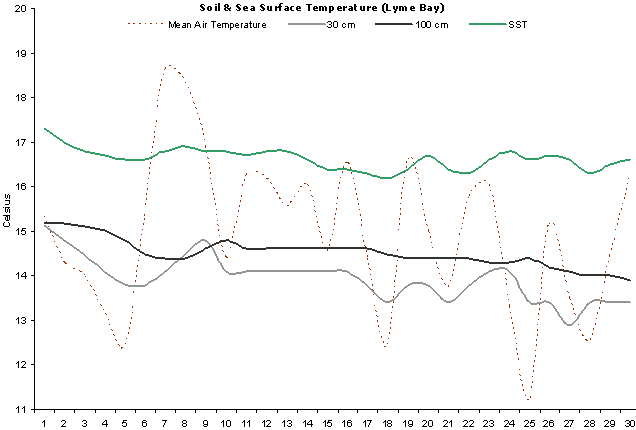 |
|
Figure 4. Soil & sea
surface temperature (SST) for Lyme Bay for September 2009. |
 |
|
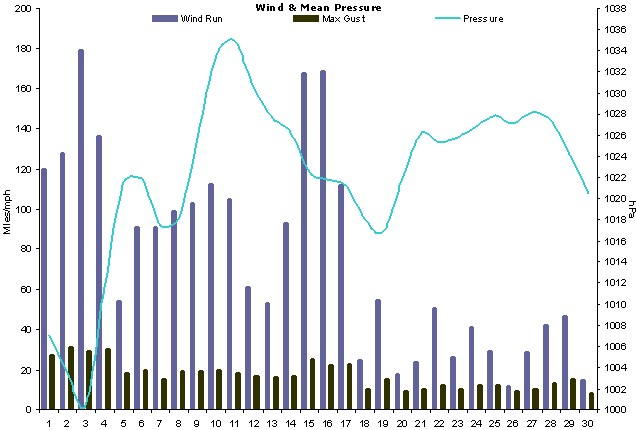
Figure 5.
Wind run, maximum
gusts and mean
pressure for September 2009. |