|
Summary for |
August
2010 |
|
Mean Max: |
21.1ºC |
(-0.1ºC) |
|
Mean Min: |
11.4ºC |
(-0.6ºC) |
|
Mean: |
16.2ºC |
(-0.4ºC) |
|
|
|
|
|
High Max: |
25.1ºC |
6th |
|
Low Max: |
16.8ºC |
25th |
|
High Min: |
18.3ºC |
21st |
|
Low Min: |
3.3ºC |
30th |
|
Mean Grass Min: |
9.7ºC |
|
|
Grass Min: |
2.4ºC |
30th |
|
|
|
|
|
Rain Total (gauge): |
81.2 mm |
(169%) |
|
Rain Total (tipping bucket): |
75.7 mm |
(157%) |
|
Rain Days >0.2 mm: |
14 Days |
|
|
Rain Days >1.0 mm: |
12 Days |
|
|
Max 24 hrs: |
15.8 mm |
23rd |
|
Days without any rain: |
17 |
|
|
|
|
|
|
Air Frost: |
0 Days |
|
|
Ground Frost: |
0 Days |
|
|
Snow Falling: |
0 Days |
|
|
Snow (50%) @ 9am: |
0 Days |
|
|
Thunder Heard: |
0 Days |
|
|
Hail <5 mm: |
0 Days |
|
|
Hail >5 mm: |
0 Days |
|
|
Fog @ 9am: |
0 Days |
|
|
|
|
|
|
Total Monthly Sunshine: |
172h:23m |
|
|
Total Monthly Sunshine: |
172.3 Hours |
|
|
Most Sunshine in a Day: |
13h:18m |
30th |
|
Average Daily Sunshine: |
05h:33m |
|
|
Sunless Days: |
1 Days |
|
|
Cloudless Days: |
1 Days |
|
|
Total Possible Sunshine: |
448h:59m |
|
|
Percentage of Total Sun: |
38% |
|
|
|
|
|
|
Mean Soil Temp @ 30 cm: |
15.7ºC |
|
|
Min Soil Temp @ 30 cm: |
14.2ºC |
30th |
|
Max Soil Temp @ 30 cm: |
16.9ºC |
31st |
|
Mean Soil Temp @ 100 cm: |
15.5ºC |
|
|
Min Soil Temp @ 100 cm: |
14.9ºC |
31st |
|
Max Soil Temp @ 100 cm: |
17.0ºC |
4th |
|
|
|
|
|
Mean 10 Min Wind >39 mph: |
0.00 Days |
|
|
N: |
1.92 Days |
|
|
NE: |
1.71 Days |
|
|
E: |
1.01 Days |
|
|
SE: |
3.54 Days |
|
|
S: |
4.19 Days |
|
|
SW: |
3.66 Days |
|
|
W: |
9.34 Days |
|
|
NW: |
5.64 Days |
|
|
Calm: |
0.00 Days |
|
|
Mean Wind: |
2.7 mph |
|
|
Max Gust: |
25 mph |
4th |
|
|
|
|
|
Mean Cloud Cover: |
61% |
|
|
Mean RH @ 9am: |
88% |
|
|
Rain Duration >0.1mm/hour: |
33.8 Hours |
|
|
Frost Duration: |
0.0 Hours |
|
|
Max Frost Duration in a Day: |
0.0 Hours |
|
|
|
|
|
|
Mean Sea Temperature: |
17.1ºC |
|
|
Normal for Month: |
|
|
|
Max Sea Temperature: |
17.8ºC |
22nd |
|
Min Sea Temperature: |
16.8ºC |
6th |
|
|
|
|
|
Mean Pressure @ 9am: |
1014.6 hPa |
(-2.7 hPa) |
|
Mean Pressure: |
1014.8 hPa |
(-2.5 hPa) |
|
Max Pressure: |
1026.3 hPa |
30th |
|
Min Pressure: |
998.2 hPa |
23rd |
|
|
|
|
|
Max Dewpoint: |
17.8ºC |
21st |
|
Min Dewpoint: |
1.1ºC |
30th |
|
Mean Dewpoint: |
11.0ºC |
|
|
|
|
|
|
Max Humidity: |
93% |
20th |
|
Min Humidity: |
42% |
30th |
|
Mean Humidity: |
76% |
(-2) |
|
|
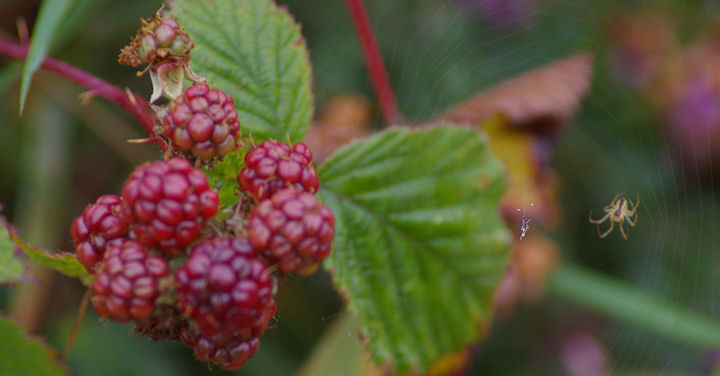
A
disappointingly cloudy and cool month.
Temperatures were
below normal by day and night.
Despite
the poor amounts of sunshine and warmth this was still the
sunniest and warmest August since 2007. |
|
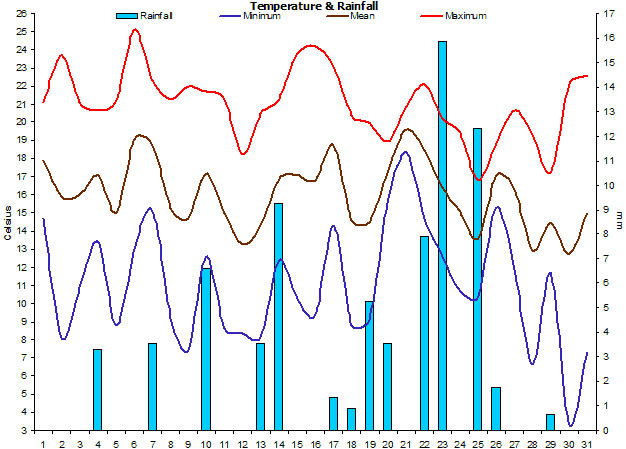
Rainfall was sporadic and
only fell on a few days, but one day (23rd) had 15.8 mm
of rain. |
|
As you
would expect from a summer month, there were
no air or grass
frosts. |
|
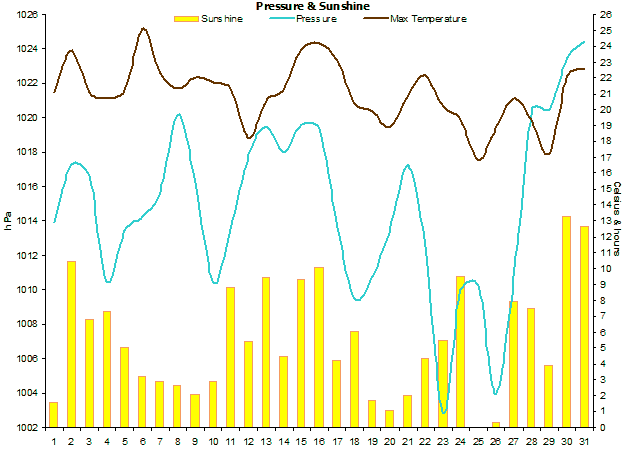
Sunshine
amounts were generally quite low though there was an
improvement during the last week. |
|
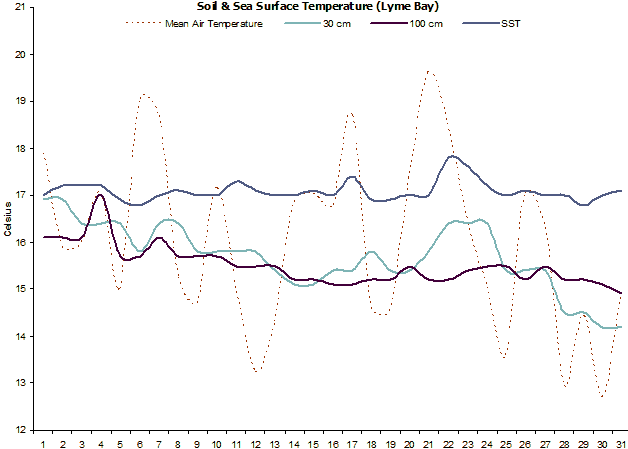
Soil temperatures were
around normal throughout the month. |
|
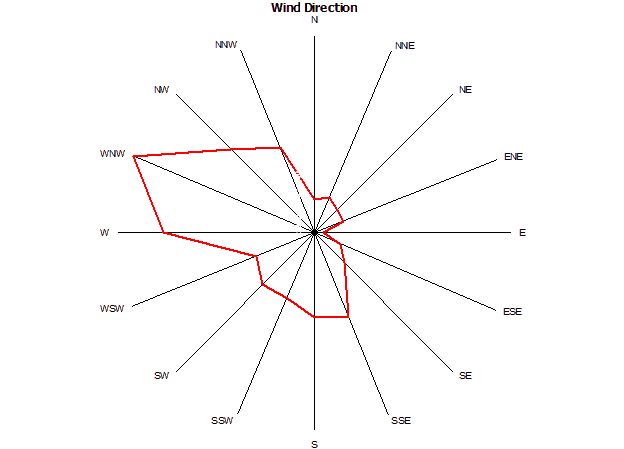
Winds were dominant from
the west sectors, though there were frequent sea breezes
from the SSE. |
|
Rainfall duration was 33.8 hours. |
|
Sea temperatures feel
slightly throughout the month, mainly due to run of
quite cool nights. |
|
Mean pressure was below
average and indicative of the unsettled nature of this
month. |
|
Dewpoints were below
average. |
|
The RH ended up being
slightly below normal. |
|
|
|
Weather Data for Otter Valley, Devon. |
August 2010 |
|
|
|
Temp (oC) |
Hum (RH%) |
Dewpoint (oC) |
Wind (mph) |
Rain |
Pressure (hPa) |
Grass |
Sun |
|
|
|
Min |
Max |
Ave |
Min |
Max |
Ave |
Min |
Max |
Ave |
Max |
Ave |
Run |
mm |
Min |
Max |
Ave |
Min |
Hours |
Observations |
|
1 |
14.7 |
21.1 |
17.9 |
58 |
86 |
72 |
10.9 |
13.0 |
12.0 |
12 |
3.0 |
61 |
0.0 |
1013 |
1015 |
1014 |
13.7 |
1.6 |
Sunny intervals all day |
|
2 |
8.1 |
23.7 |
15.9 |
47 |
91 |
69 |
5.5 |
12.7 |
9.1 |
19 |
3.2 |
78 |
0.0 |
1015 |
1019 |
1017 |
11.4 |
10.5 |
Sunny intervals all day |
|
3 |
10.9 |
21.1 |
16.0 |
66 |
90 |
78 |
7.5 |
16.1 |
11.8 |
15 |
2.7 |
66 |
0.0 |
1014 |
1019 |
1017 |
9.1 |
6.8 |
Sunny intervals all day |
|
4 |
13.4 |
20.7 |
17.1 |
57 |
88 |
73 |
9.2 |
15.2 |
12.2 |
25 |
5.5 |
133 |
3.3 |
1007 |
1014 |
1010 |
11.8 |
7.3 |
Showers am, sunny ints pm |
|
5 |
8.8 |
21.2 |
15.0 |
47 |
91 |
69 |
6.2 |
12.4 |
9.3 |
10 |
0.6 |
14 |
0.0 |
1012 |
1015 |
1013 |
6.5 |
5.0 |
Sunny intervals all day |
|
6 |
13.0 |
25.1 |
19.1 |
58 |
89 |
74 |
9.3 |
17.7 |
13.5 |
0 |
0.0 |
0 |
0.0 |
1013 |
1016 |
1014 |
12.8 |
3.2 |
Sunny intervals all day |
|
7 |
15.1 |
22.3 |
18.7 |
60 |
89 |
75 |
11.8 |
14.5 |
13.2 |
0 |
0.0 |
0 |
3.5 |
1013 |
1018 |
1016 |
10.3 |
2.9 |
Sunny intervals all day |
|
8 |
9.2 |
21.3 |
15.3 |
61 |
91 |
76 |
6.9 |
13.9 |
10.4 |
0 |
0.0 |
0 |
0.0 |
1018 |
1022 |
1020 |
7.3 |
2.6 |
Brief sunny intervals all day |
|
9 |
7.4 |
22.0 |
14.7 |
69 |
90 |
80 |
4.8 |
16.2 |
10.5 |
16 |
0.8 |
20 |
0.0 |
1013 |
1020 |
1016 |
5.9 |
2.1 |
Brief sunny intervals all day |
|
10 |
12.6 |
21.7 |
17.2 |
75 |
91 |
83 |
9.8 |
17.6 |
13.7 |
20 |
2.7 |
66 |
6.6 |
1008 |
1013 |
1010 |
12.3 |
2.9 |
Rain am, sunny intervals pm |
|
11 |
8.6 |
21.3 |
15.0 |
52 |
92 |
72 |
6.5 |
13.7 |
10.1 |
18 |
3.4 |
82 |
0.0 |
1011 |
1016 |
1014 |
8.0 |
8.9 |
Sunny intervals all day |
|
12 |
8.3 |
18.2 |
13.3 |
61 |
91 |
76 |
6.0 |
12.3 |
9.2 |
21 |
4.1 |
99 |
0.0 |
1016 |
1020 |
1018 |
6.8 |
5.4 |
Sunny am, cloudy pm |
|
13 |
8.1 |
20.5 |
14.3 |
56 |
91 |
74 |
5.7 |
11.6 |
8.7 |
23 |
2.3 |
54 |
3.5 |
1019 |
1020 |
1019 |
6.1 |
9.5 |
Sunny intervals all day |
|
14 |
12.4 |
21.3 |
16.9 |
58 |
91 |
75 |
10.0 |
13.9 |
12.0 |
16 |
1.7 |
40 |
9.2 |
1016 |
1020 |
1018 |
11.4 |
4.4 |
Sunshine & showers all day |
|
15 |
10.3 |
23.8 |
17.1 |
55 |
92 |
74 |
8.3 |
15.0 |
11.7 |
0 |
0.0 |
0 |
0.0 |
1017 |
1022 |
1020 |
8.4 |
9.3 |
Sunny intervals all day |
|
16 |
9.4 |
24.2 |
16.8 |
46 |
91 |
69 |
7.1 |
13.3 |
10.2 |
0 |
0.0 |
0 |
0.0 |
1017 |
1022 |
1019 |
8.4 |
10.1 |
Sunny intervals all day |
|
17 |
14.3 |
23.1 |
18.7 |
61 |
89 |
75 |
11.6 |
16.9 |
14.3 |
0 |
0.0 |
0 |
1.3 |
1010 |
1018 |
1014 |
13.2 |
4.2 |
Cloudy am, sunny ints pm |
|
18 |
8.8 |
20.4 |
14.6 |
56 |
91 |
74 |
6.2 |
12.9 |
9.6 |
0 |
0.0 |
0 |
0.9 |
1008 |
1011 |
1009 |
6.7 |
6.1 |
Sun & light showers pm |
|
19 |
9.2 |
19.9 |
14.6 |
70 |
91 |
81 |
6.5 |
14.7 |
10.6 |
0 |
0.0 |
0 |
5.3 |
1010 |
1012 |
1011 |
7.1 |
1.7 |
Brief sunny intervals all day |
|
20 |
15.8 |
18.9 |
17.4 |
90 |
93 |
92 |
13.7 |
17.2 |
15.5 |
0 |
0.0 |
0 |
3.5 |
1011 |
1016 |
1014 |
14.6 |
1.1 |
Brief sunny ints and drizzle |
|
21 |
18.3 |
20.9 |
19.6 |
83 |
92 |
88 |
16.1 |
17.8 |
17.0 |
0 |
0.0 |
0 |
0.0 |
1016 |
1018 |
1017 |
17.4 |
2.0 |
Brief sunny intervals all day |
|
22 |
14.7 |
22.1 |
18.4 |
65 |
90 |
78 |
12.5 |
16.3 |
14.4 |
0 |
0.0 |
0 |
7.9 |
1008 |
1017 |
1013 |
13.0 |
4.3 |
Sunny ints am, cloudy pm |
|
23 |
12.6 |
20.2 |
16.4 |
59 |
92 |
76 |
9.3 |
16.5 |
12.9 |
0 |
0.0 |
0 |
15.8 |
998 |
1007 |
1003 |
13.7 |
5.5 |
Showers am, sunny ints pm |
|
24 |
10.7 |
19.4 |
15.1 |
59 |
89 |
74 |
8.0 |
12.3 |
10.2 |
0 |
0.0 |
0 |
0.0 |
1006 |
1014 |
1010 |
9.2 |
9.5 |
Showers am, sunny ints pm |
|
25 |
10.4 |
16.8 |
13.6 |
76 |
92 |
84 |
7.6 |
15.2 |
11.4 |
0 |
0.0 |
0 |
12.3 |
1005 |
1016 |
1010 |
13.8 |
0.0 |
Rain intermittent all day |
|
26 |
15.3 |
18.8 |
17.1 |
81 |
93 |
87 |
12.8 |
16.6 |
14.7 |
0 |
0.0 |
0 |
1.8 |
1003 |
1005 |
1004 |
11.7 |
0.4 |
Sunny ints am, cloudy pm |
|
27 |
11.9 |
20.7 |
16.3 |
49 |
90 |
70 |
9.1 |
12.6 |
10.9 |
0 |
0.0 |
0 |
0.0 |
1004 |
1018 |
1011 |
5.5 |
7.9 |
Sunny intervals all day |
|
28 |
6.6 |
19.3 |
13.0 |
55 |
92 |
74 |
4.2 |
12.3 |
8.3 |
0 |
0.0 |
0 |
0.0 |
1018 |
1023 |
1021 |
10.0 |
7.5 |
Sunny intervals all day |
|
29 |
11.7 |
17.2 |
14.5 |
64 |
90 |
77 |
5.5 |
12.2 |
8.9 |
0 |
0.0 |
0 |
0.7 |
1018 |
1023 |
1020 |
2.4 |
3.9 |
Sunny intervals all day |
|
30 |
3.3 |
22.1 |
12.7 |
42 |
92 |
67 |
1.1 |
10.3 |
5.7 |
0 |
0.0 |
0 |
0.0 |
1021 |
1026 |
1024 |
8.0 |
13.3 |
Sunny all day |
|
31 |
7.3 |
22.6 |
15.0 |
53 |
90 |
72 |
4.4 |
13.3 |
8.9 |
0 |
0.0 |
0 |
0.0 |
1023 |
1026 |
1024 |
5.3 |
12.6 |
Sunny intervals all day |
|
|
11.0 |
21.0 |
16.0 |
61 |
91 |
76 |
8.2 |
14.4 |
11.3 |
18 |
2.7 |
711 |
75.7 |
1012 |
1018 |
1015 |
9.7 |
172.30 |
|
|
|
Graphs for
August 2010 |
 |
|
Figure 1. Temperature and
Rainfall for August 2010. |
 |
|
Figure 2. Sunshine, air
pressure and mean wind speed for August 2010. |
 |
|
Figure 3.
Wind direction for August 2010. |
 |
|
Figure 4. Soil & sea
surface temperature (SST) for Lyme Bay for August 2010. |