|
Summary for |
February
2010 |
|
Mean Max: |
7.1ºC |
(-1.5ºC) |
|
Mean Min: |
1.6ºC |
(-1.2ºC) |
|
Mean: |
4.3ºC |
(-1.4ºC) |
|
|
|
|
|
High Max: |
10.3ºC |
27th |
|
Low Max: |
3.5ºC |
13th |
|
High Min: |
7.2ºC |
4th |
|
Low Min: |
-4.3ºC |
1st |
|
Mean Grass Min: |
-1.4ºC |
|
|
Grass Min: |
-8.5ºC |
12th |
|
|
|
|
|
Rain Total (gauge): |
92.0 mm |
(121%) |
|
Rain Total (tipping bucket): |
91.6 mm |
(120%) |
|
Rain Days >0.2 mm: |
20 Days |
|
|
Rain Days >1.0 mm: |
13 Days |
|
|
Max 24 hrs: |
15.5 mm |
18th |
|
Days without any rain: |
8 |
|
|
|
|
|
|
Air Frost: |
6 Days |
|
|
Ground Frost: |
17 Days |
|
|
Snow Falling: |
0 Days |
|
|
Snow (50%) @ 9am: |
0 Days |
|
|
Thunder Heard: |
0 Days |
|
|
Hail <5 mm: |
1 Days |
|
|
Hail >5 mm: |
0 Days |
|
|
Fog @ 9am: |
0 Days |
|
|
|
|
|
|
Total Monthly Sunshine: |
67h:22m |
|
|
Total Monthly Sunshine: |
67.0 Hours |
|
|
Most Sunshine in a Day: |
07h:29m |
26th |
|
Average Daily Sunshine: |
02h:24m |
|
|
Sunless Days: |
6 Days |
|
|
Cloudless Days: |
0 Days |
|
|
Total Possible Sunshine: |
281h:21m |
|
|
Percentage of Total Sun: |
24% |
|
|
|
|
|
|
Mean Soil Temp @ 30 cm: |
3.6ºC |
|
|
Min Soil Temp @ 30 cm: |
2.1ºC |
2nd |
|
Max Soil Temp @ 30 cm: |
5.2ºC |
28th |
|
Mean Soil Temp @ 100 cm: |
5.1ºC |
|
|
Min Soil Temp @ 100 cm: |
4.7ºC |
22nd |
|
Max Soil Temp @ 100 cm: |
5.4ºC |
7th |
|
|
|
|
|
Mean 10 Min Wind >39 mph: |
0.00 Days |
|
|
N: |
7.15 Days |
|
|
NE: |
2.60 Days |
|
|
E: |
2.51 Days |
|
|
SE: |
3.40 Days |
|
|
S: |
2.11 Days |
|
|
SW: |
2.26 Days |
|
|
W: |
4.39 Days |
|
|
NW: |
1.75 Days |
|
|
Calm: |
4.83 Days |
|
|
Mean Wind: |
3.5 mph |
|
|
Max Gust: |
31 mph |
26th |
|
|
|
|
|
Mean Cloud Cover: |
66% |
|
|
Mean RH @ 9am: |
88% |
|
|
Rain Duration >0.1mm/hour: |
55.5 Hours |
|
|
Frost Duration: |
77.5 Hours |
|
|
Max Frost Duration in a Day: |
14.5 Hours |
20th |
|
% of time with Air Frost: |
12% |
|
|
|
|
|
|
Mean Sea Temperature: |
6.6ºC |
|
|
Normal for Month: |
|
|
|
Max Sea Temperature: |
7.1ºC |
8th |
|
Min Sea Temperature: |
6.3ºC |
15th |
|
|
|
|
|
Mean Pressure @ 9am: |
1003.5 hPa |
(-11.6 hPa) |
|
Mean Pressure: |
1003.2 hPa |
(-11.9 hPa) |
|
Max Pressure: |
1025.0 hPa |
13th |
|
Min Pressure: |
980.3 hPa |
25th |
|
|
|
|
|
Max Dewpoint: |
8.1ºC |
24th |
|
Min Dewpoint: |
-6.8ºC |
12th |
|
Mean Dewpoint: |
1.0ºC |
|
|
|
|
|
|
Max Humidity: |
93% |
4th |
|
Min Humidity: |
56% |
11th |
|
Mean Humidity: |
83% |
(-2) |
|
|
A
generally unsettled, cold and often wet month.
A warm
start and end but generally temperatures were below
normal though there were no really cold days. A
scattering of frosts but nothing severe and rainfall
rather above the average. Sunshine levels were
disappointingly low at times and unusually there were no
cloud-free days. |
|
Overall rainfall was
rather wetter than normal with 121%. |
|
There was
no snow lying on the ground at any point during this
month. |
|
Sunshine
levels were a little below average and there were no
days which were cloud-free. |
|
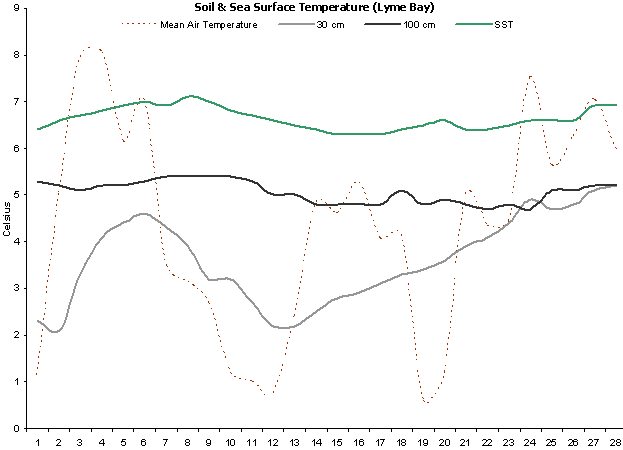
Soil temperatures were
well below normal throughout. |
|
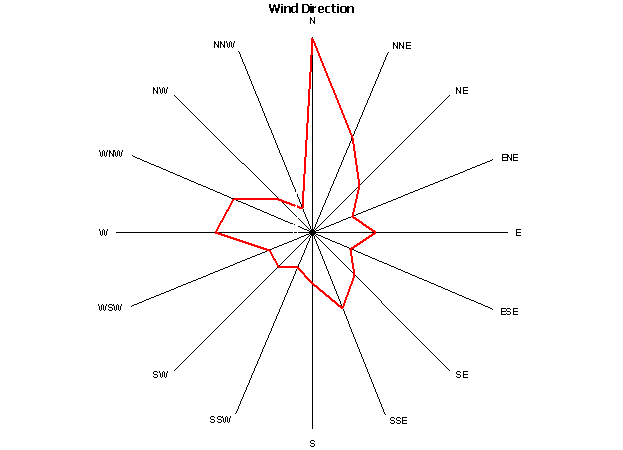
Winds were dominant from
the north (again). Brrrrr!!!! |
|
Rainfall duration for the
whole month was a very low despite rainfall being above
average. |
|
Sea temperatures remained
reasonably static throughout the month, rising slightly
at the end. |
|
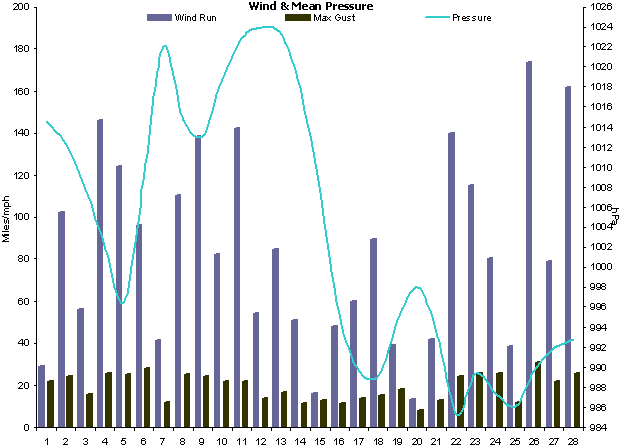
Mean pressure was well
below normal and indicative this unsettled month. |
|
Dewpoints were well below
normal due to frequent incursions of very dry and cold,
Continental air. |
|
The RH ended up being a
little below normal. |
|
|
|
Weather Data for Otter Valley, Devon. |
February 2010 |
|
|
|
Temp (oC) |
Hum (RH%) |
Dewpoint (oC) |
Wind (mph) |
Rain |
Pressure (hPa) |
Grass |
Sun |
|
|
|
Min |
Max |
Ave |
Min |
Max |
Ave |
Min |
Max |
Ave |
Max |
Ave |
Run |
mm |
Min |
Max |
Ave |
Min |
Hours |
Observations |
|
1 |
-4.3 |
6.6 |
1.2 |
73 |
91 |
82 |
-6.2 |
2.9 |
-1.7 |
22 |
1.2 |
29 |
0.0 |
1011 |
1019 |
1015 |
-7.7 |
5.6 |
Sunny intervals all day |
|
2 |
1.4 |
8.7 |
5.1 |
86 |
91 |
89 |
-3.4 |
6.7 |
1.7 |
24 |
4.3 |
102 |
6.7 |
1006 |
1019 |
1012 |
-0.7 |
1.6 |
Brief sunny intervals all day |
|
3 |
5.7 |
10.2 |
8.0 |
85 |
92 |
89 |
3.7 |
7.8 |
5.8 |
16 |
2.3 |
56 |
3.3 |
1007 |
1009 |
1008 |
5.3 |
0.0 |
Cloudy all day |
|
4 |
7.2 |
8.9 |
8.1 |
80 |
93 |
87 |
3.9 |
6.8 |
5.4 |
26 |
6.1 |
146 |
4.0 |
996 |
1008 |
1002 |
4.7 |
0.3 |
Rain am, bright pm |
|
5 |
2.2 |
10.1 |
6.2 |
80 |
93 |
87 |
0.3 |
7.4 |
3.9 |
25 |
5.2 |
124 |
13.1 |
994 |
1000 |
997 |
0.3 |
2.8 |
Sunny ints & showers |
|
6 |
5.1 |
8.9 |
7.0 |
81 |
91 |
86 |
1.2 |
5.8 |
3.5 |
28 |
4.0 |
96 |
3.8 |
997 |
1022 |
1010 |
2.6 |
4.8 |
Sunny intervals all day |
|
7 |
2.4 |
4.6 |
3.5 |
79 |
91 |
85 |
0.0 |
2.4 |
1.2 |
12 |
1.7 |
42 |
0.5 |
1019 |
1025 |
1022 |
1.3 |
0.0 |
Dull all day |
|
8 |
2.1 |
4.2 |
3.2 |
77 |
89 |
83 |
-1.4 |
0.8 |
-0.3 |
25 |
4.6 |
111 |
0.0 |
1010 |
1019 |
1015 |
-0.6 |
2.2 |
Sunny intervals all day |
|
9 |
0.1 |
5.3 |
2.7 |
71 |
84 |
78 |
-3.5 |
0.0 |
-1.8 |
24 |
5.8 |
138 |
0.0 |
1010 |
1016 |
1013 |
-4.5 |
2.0 |
Sunny ints & hail showers |
|
10 |
-2.4 |
4.8 |
1.2 |
60 |
89 |
75 |
-5.3 |
-0.7 |
-3.0 |
22 |
3.4 |
83 |
0.0 |
1016 |
1021 |
1019 |
-7.6 |
2.8 |
Sunny intervals all day |
|
11 |
-2.0 |
4.0 |
1.0 |
56 |
84 |
70 |
-5.7 |
-3.5 |
-4.6 |
22 |
5.9 |
142 |
0.0 |
1022 |
1024 |
1023 |
-7.6 |
6.8 |
Sunny intervals all day |
|
12 |
-4.1 |
5.6 |
0.8 |
75 |
88 |
82 |
-6.8 |
1.2 |
-2.8 |
14 |
2.3 |
54 |
0.0 |
1023 |
1025 |
1024 |
-8.5 |
2.3 |
Sunny intervals all day |
|
13 |
1.3 |
3.5 |
2.4 |
63 |
83 |
73 |
-3.9 |
0.1 |
-1.9 |
17 |
3.5 |
85 |
0.0 |
1022 |
1025 |
1023 |
-0.8 |
0.4 |
Brief sunny intervals all day |
|
14 |
1.7 |
8.0 |
4.9 |
62 |
85 |
74 |
-2.2 |
1.6 |
-0.3 |
11 |
2.1 |
51 |
0.0 |
1014 |
1022 |
1018 |
-2.6 |
3.5 |
Bright am, sunny pm |
|
15 |
1.7 |
7.5 |
4.6 |
76 |
90 |
83 |
-1.0 |
4.5 |
1.8 |
13 |
0.7 |
17 |
0.7 |
1001 |
1014 |
1007 |
1.1 |
0.0 |
Cloudy all day |
|
16 |
3.3 |
7.2 |
5.3 |
81 |
90 |
86 |
-1.4 |
4.2 |
1.4 |
11 |
2.0 |
48 |
10.5 |
991 |
1000 |
995 |
0.9 |
0.9 |
Rain intermittent all day |
|
17 |
1.8 |
6.3 |
4.1 |
75 |
92 |
84 |
-2.2 |
3.6 |
0.7 |
14 |
2.5 |
60 |
6.2 |
989 |
991 |
990 |
-3.7 |
0.1 |
Rain am, bright pm |
|
18 |
2.7 |
5.6 |
4.2 |
79 |
91 |
85 |
-0.4 |
3.9 |
1.8 |
15 |
3.7 |
89 |
15.5 |
987 |
991 |
989 |
0.5 |
0.2 |
Rain am, showers pm |
|
19 |
-4.1 |
5.3 |
0.6 |
73 |
91 |
82 |
-5.9 |
2.2 |
-1.9 |
18 |
1.6 |
39 |
0.2 |
991 |
998 |
995 |
-7.3 |
5.5 |
Showers & sun all day |
|
20 |
-4.2 |
6.6 |
1.2 |
73 |
91 |
82 |
-6.0 |
2.5 |
-1.8 |
8 |
0.5 |
14 |
0.2 |
997 |
999 |
998 |
-2.9 |
6.9 |
Snow flurries, sunny pm |
|
21 |
1.4 |
8.6 |
5.0 |
74 |
92 |
83 |
-4.1 |
4.3 |
0.1 |
13 |
1.7 |
42 |
0.7 |
989 |
998 |
994 |
-3.3 |
4.1 |
Sunny ints all day |
|
22 |
3.2 |
5.5 |
4.4 |
81 |
90 |
86 |
-0.1 |
3.6 |
1.8 |
24 |
5.8 |
140 |
3.8 |
981 |
990 |
985 |
3.1 |
0.0 |
Rain intermittent all day |
|
23 |
1.7 |
7.2 |
4.5 |
79 |
92 |
86 |
-1.1 |
5.5 |
2.2 |
26 |
4.8 |
115 |
4.3 |
988 |
991 |
989 |
-1.8 |
0.0 |
Rain intermittent all day |
|
24 |
4.9 |
10.1 |
7.5 |
83 |
93 |
88 |
3.3 |
8.1 |
5.7 |
26 |
3.7 |
81 |
1.2 |
985 |
990 |
987 |
1.3 |
1.9 |
Sunny intervals all day |
|
25 |
3.4 |
7.9 |
5.7 |
89 |
92 |
91 |
1.7 |
6.1 |
3.9 |
12 |
1.6 |
39 |
4.0 |
980 |
992 |
986 |
-1.2 |
0.0 |
Cloudy am, rain pm |
|
26 |
3.3 |
9.2 |
6.3 |
57 |
91 |
74 |
-0.5 |
3.9 |
1.7 |
31 |
7.2 |
174 |
1.0 |
981 |
999 |
990 |
-0.9 |
7.5 |
Sunny intervals all day |
|
27 |
3.8 |
10.3 |
7.1 |
80 |
92 |
86 |
-0.2 |
6.9 |
3.4 |
22 |
3.3 |
79 |
11.4 |
986 |
998 |
992 |
-0.2 |
2.9 |
Showers am, sunny ints pm |
|
28 |
4.3 |
7.6 |
6.0 |
70 |
91 |
81 |
1.2 |
4.4 |
2.8 |
26 |
6.7 |
162 |
0.5 |
982 |
1003 |
993 |
1.4 |
2.0 |
Cloudy am, sunny ints pm |
|
|
1.6 |
7.1 |
4.3 |
75 |
90 |
83 |
-1.7 |
3.8 |
1.0 |
20 |
3.5 |
2356 |
91.6 |
999 |
1007 |
1003 |
-1.4 |
67.0 |
|
|
|
Graphs for
February 2010 |
 |
|
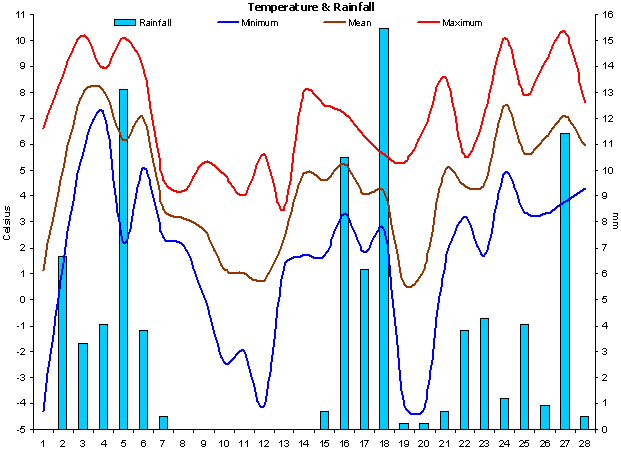
Figure 1. Temperature and
Rainfall for February 2010. |
 |
|
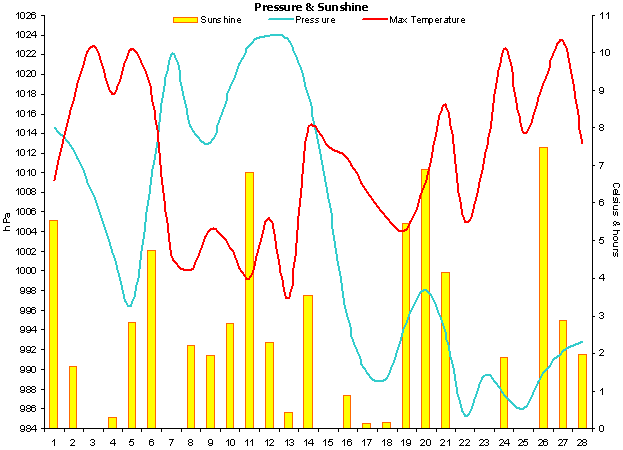
Figure 2. Sunshine, air
pressure and mean wind speed for February 2010. |
 |
|
Figure 3.
Wind direction for February 2010. |
 |
|
Figure 4. Soil & sea
surface temperature (SST) for Lyme Bay for February 2010. |
 |
|
Figure 5.
Wind run, maximum
gusts and mean
pressure for February 2010. |