|
Summary for |
July
2010 |
|
Mean Max: |
22.8ºC |
(+1.3ºC) |
|
Mean Min: |
13.4ºC |
(+1.1ºC) |
|
Mean: |
18.1ºC |
(+1.2ºC) |
|
|
|
|
|
High Max: |
27.3ºC |
9th |
|
Low Max: |
19.3ºC |
24th |
|
High Min: |
17.3ºC |
27th |
|
Low Min: |
7.6ºC |
6th |
|
Mean Grass Min: |
11.6ºC |
|
|
Grass Min: |
5.5ºC |
6th |
|
|
|
|
|
Rain Total (gauge): |
41.6 mm |
(102%) |
|
Rain Total (tipping bucket): |
40.9 mm |
(100%) |
|
Rain Days >0.2 mm: |
10 Days |
|
|
Rain Days >1.0 mm: |
8 Days |
|
|
Max 24 hrs: |
13.4 mm |
15th |
|
Days without any rain: |
21 |
|
|
|
|
|
|
Air Frost: |
0 Days |
|
|
Ground Frost: |
0 Days |
|
|
Snow Falling: |
0 Days |
|
|
Snow (50%) @ 9am: |
0 Days |
|
|
Thunder Heard: |
2 Days |
|
|
Hail <5 mm: |
0 Days |
|
|
Hail >5 mm: |
0 Days |
|
|
Fog @ 9am: |
0 Days |
|
|
|
|
|
|
Total Monthly Sunshine: |
201h:10m |
|
|
Total Monthly Sunshine: |
201.2 Hours |
|
|
Most Sunshine in a Day: |
11h:46m |
28th |
|
Average Daily Sunshine: |
06h:29m |
|
|
Sunless Days: |
0 Days |
|
|
Cloudless Days: |
0 Days |
|
|
Total Possible Sunshine: |
495h:19m |
|
|
Percentage of Total Sun: |
41% |
|
|
|
|
|
|
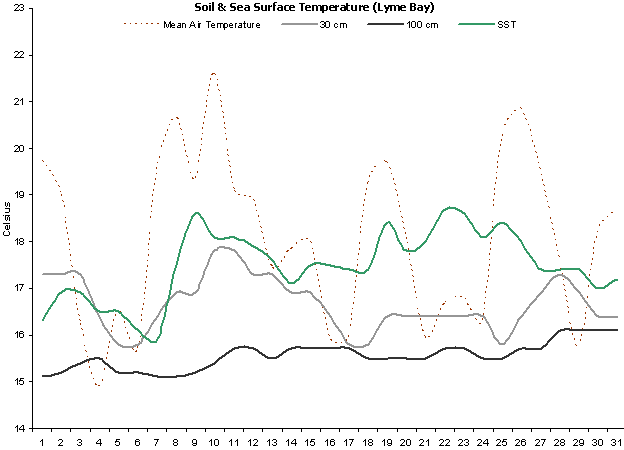
Mean Soil Temp @ 30 cm: |
16.7ºC |
|
|
Min Soil Temp @ 30 cm: |
15.8ºC |
5th |
|
Max Soil Temp @ 30 cm: |
17.8ºC |
10th |
|
Mean Soil Temp @ 100 cm: |
15.6ºC |
|
|
Min Soil Temp @ 100 cm: |
15.1ºC |
1st |
|
Max Soil Temp @ 100 cm: |
16.1ºC |
28th |
|
|
|
|
|
Mean 10 Min Wind >39 mph: |
0.00 Days |
|
|
N: |
0.44 Days |
|
|
NE: |
0.32 Days |
|
|
E: |
0.70 Days |
|
|
SE: |
9.22 Days |
|
|
S: |
5.44 Days |
|
|
SW: |
3.04 Days |
|
|
W: |
8.10 Days |
|
|
NW: |
2.02 Days |
|
|
Calm: |
1.72 Days |
|
|
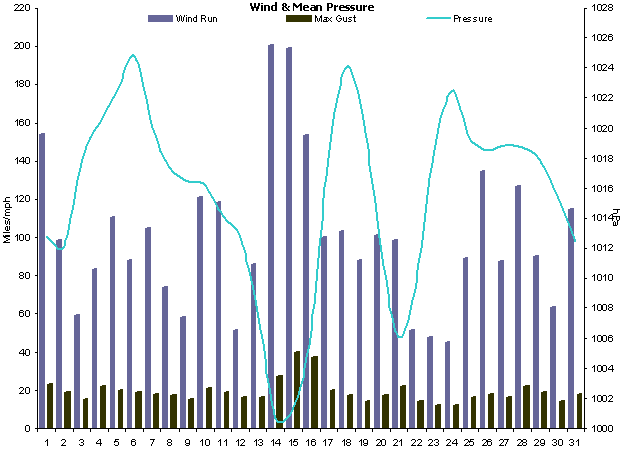
Mean Wind: |
4.2 mph |
|
|
Max Gust: |
40 mph |
15th |
|
|
|
|
|
Mean Cloud Cover: |
59% |
|
|
Mean RH @ 9am: |
85% |
|
|
Rain Duration >0.1mm/hour: |
21.8 Hours |
|
|
Frost Duration: |
0.0 Hours |
|
|
Max Frost Duration in a Day: |
0.0 Hours |
|
|
|
|
|
|
Mean Sea Temperature: |
17.5ºC |
|
|
Normal for Month: |
|
|
|
Max Sea Temperature: |
18.7ºC |
22nd |
|
Min Sea Temperature: |
15.9ºC |
7th |
|
|
|
|
|
Mean Pressure @ 9am: |
1015.9 hPa |
(-1.4 hPa) |
|
Mean Pressure: |
1015.4 hPa |
(-1.9 hPa) |
|
Max Pressure: |
1027.1 hPa |
6th |
|
Min Pressure: |
996.6 hPa |
15th |
|
|
|
|
|
Max Dewpoint: |
17.8ºC |
10th |
|
Min Dewpoint: |
5.0ºC |
6th |
|
Mean Dewpoint: |
12.5ºC |
|
|
|
|
|
|
Max Humidity: |
92% |
16th |
|
Min Humidity: |
41% |
6th |
|
Mean Humidity: |
73% |
(-3) |
|
|
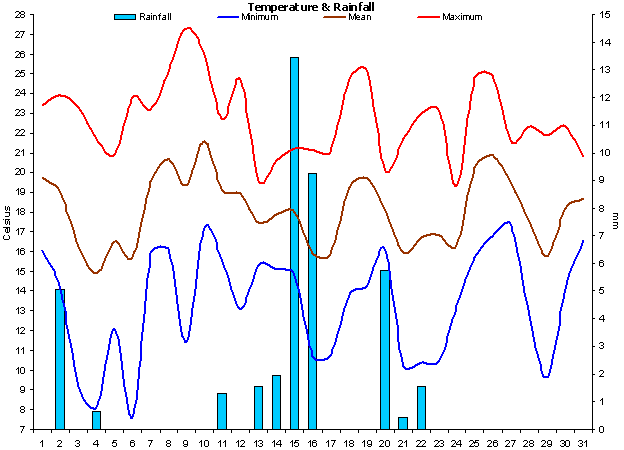
A
warm month with average rainfall but disappointing
sunshine amounts.
Temperatures were
warm by day and night, mainly due to high amounts of
cloud cover.
Despite
the poor amounts of sunshine this was still the
sunniest, warmest and driest July since 2006. |
|
Rainfall was sporadic and
only fell on a few days, but one day (15th) had 13.4 mm
of rain. |
|
As you
would expect from a summer month, there were
no air or grass
frosts. |
|
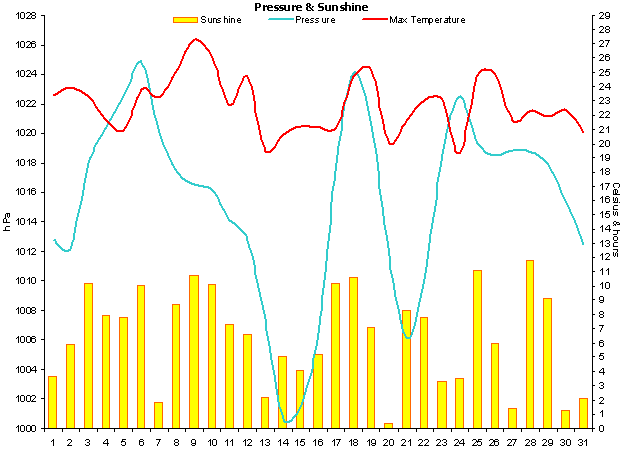
Sunshine
amounts were generally quite low and unlike June, there
were no completely cloudless days. |
|
Soil temperatures were
around normal throughout the month. |
|
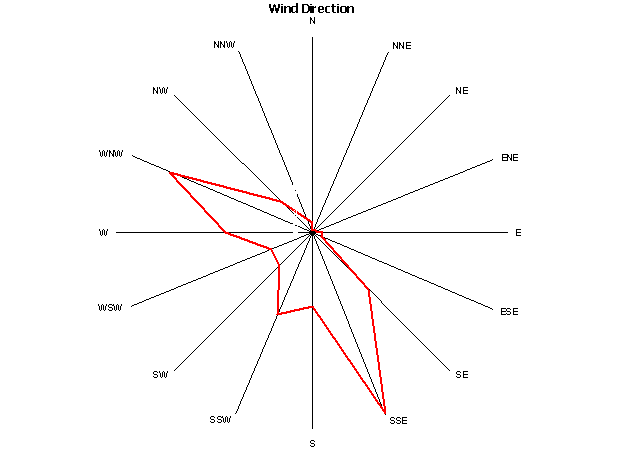
Winds were dominant from
the west sectors, though there were frequent sea breezes
from the SSE. |
|
Rainfall duration was just
21.8 hours. |
|
Sea temperatures rose
slowly throughout the month and ended up above normal. |
|
Mean pressure was slightly
below
average. |
|
Dewpoints were around
average. |
|
The RH ended up being
well below normal. |
|
|
|
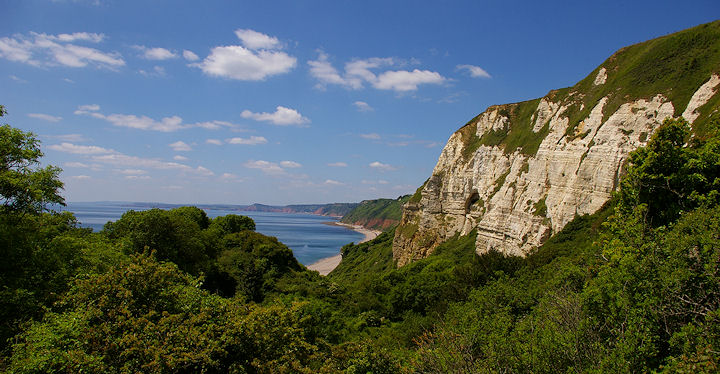
Weather Data for Otter Valley, Devon. |
July 2010 |
|
|
|
Temp (oC) |
Hum (RH%) |
Dewpoint (oC) |
Wind (mph) |
Rain |
Pressure (hPa) |
Grass |
Sun |
|
|
|
Min |
Max |
Ave |
Min |
Max |
Ave |
Min |
Max |
Ave |
Max |
Ave |
Run |
mm |
Min |
Max |
Ave |
Min |
Hours |
Observations |
|
1 |
16.1 |
23.4 |
19.8 |
60 |
87 |
74 |
10.4 |
15.9 |
13.2 |
23 |
6.5 |
154 |
0.0 |
1009 |
1017 |
1013 |
12.5 |
3.6 |
Sunny ints all day, rain even |
|
2 |
14.1 |
23.9 |
19.0 |
58 |
91 |
75 |
11.6 |
16.2 |
13.9 |
19 |
4.1 |
98 |
5.1 |
1007 |
1017 |
1012 |
14.5 |
5.9 |
Sunny intervals all day |
|
3 |
9.2 |
23.3 |
16.3 |
49 |
91 |
70 |
6.4 |
14.1 |
10.3 |
15 |
2.5 |
60 |
0.0 |
1015 |
1021 |
1018 |
7.1 |
10.2 |
Sunny intervals all day |
|
4 |
8.1 |
21.7 |
14.9 |
58 |
91 |
75 |
5.2 |
16.2 |
10.7 |
22 |
3.4 |
83 |
0.7 |
1018 |
1023 |
1020 |
6.2 |
7.9 |
Sunny intervals all day |
|
5 |
12.1 |
20.9 |
16.5 |
48 |
91 |
70 |
7.9 |
13.6 |
10.8 |
20 |
4.6 |
110 |
0.0 |
1019 |
1026 |
1023 |
6.8 |
7.8 |
Bright am, sunny pm |
|
6 |
7.6 |
23.8 |
15.7 |
41 |
91 |
66 |
5.0 |
14.2 |
9.6 |
19 |
3.7 |
88 |
0.0 |
1023 |
1027 |
1025 |
5.5 |
10.0 |
Sunny intervals all day |
|
7 |
15.9 |
23.2 |
19.6 |
58 |
85 |
72 |
9.7 |
17.4 |
13.6 |
18 |
4.4 |
105 |
0.0 |
1017 |
1023 |
1020 |
14.8 |
1.9 |
Cloudy am, sunny ints pm |
|
8 |
16.1 |
25.2 |
20.7 |
55 |
86 |
71 |
12.2 |
15.8 |
14.0 |
17 |
3.1 |
74 |
0.0 |
1016 |
1019 |
1017 |
14.1 |
8.7 |
Sunny intervals all day |
|
9 |
11.4 |
27.3 |
19.4 |
52 |
91 |
72 |
8.7 |
16.8 |
12.8 |
15 |
2.4 |
58 |
0.0 |
1016 |
1017 |
1017 |
9.8 |
10.8 |
Sunny intervals all day |
|
10 |
17.2 |
26.0 |
21.6 |
61 |
90 |
76 |
13.5 |
17.8 |
15.7 |
21 |
5.0 |
121 |
0.0 |
1014 |
1019 |
1016 |
13.7 |
10.1 |
Sunny intervals all day |
|
11 |
15.5 |
22.7 |
19.1 |
48 |
90 |
69 |
10.0 |
15.5 |
12.8 |
19 |
4.9 |
119 |
1.3 |
1012 |
1016 |
1014 |
13.9 |
7.3 |
Sunny intervals all day |
|
12 |
13.1 |
24.7 |
18.9 |
52 |
84 |
68 |
9.4 |
14.6 |
12.0 |
16 |
2.1 |
51 |
0.0 |
1010 |
1015 |
1013 |
12.3 |
6.6 |
Sunny intervals all day |
|
13 |
15.3 |
19.6 |
17.5 |
77 |
89 |
83 |
12.3 |
16.1 |
14.2 |
16 |
3.6 |
86 |
1.5 |
1004 |
1011 |
1007 |
14.5 |
2.1 |
Sunny intervals all day |
|
14 |
15.1 |
20.6 |
17.9 |
70 |
90 |
80 |
12.5 |
15.9 |
14.2 |
27 |
8.4 |
201 |
2.0 |
997 |
1005 |
1001 |
13.1 |
5.1 |
Sunshine & light showers |
|
15 |
14.8 |
21.2 |
18.0 |
52 |
91 |
72 |
10.2 |
13.4 |
11.8 |
40 |
8.3 |
199 |
13.4 |
997 |
1006 |
1001 |
13.4 |
4.1 |
Sunny ints, rain evening. |
|
16 |
10.7 |
21.1 |
15.9 |
65 |
92 |
79 |
8.4 |
15.2 |
11.8 |
37 |
6.4 |
153 |
9.2 |
1001 |
1012 |
1006 |
12.7 |
5.2 |
Sunshine & showers |
|
17 |
10.8 |
21.1 |
16.0 |
45 |
89 |
67 |
7.6 |
11.2 |
9.4 |
20 |
4.2 |
100 |
0.0 |
1013 |
1023 |
1018 |
8.6 |
10.2 |
Sunny intervals all day |
|
18 |
13.8 |
24.7 |
19.3 |
50 |
89 |
70 |
8.3 |
15.3 |
11.8 |
17 |
4.3 |
103 |
0.0 |
1023 |
1025 |
1024 |
11.0 |
10.6 |
Sunny intervals all day |
|
19 |
14.3 |
25.1 |
19.7 |
46 |
90 |
68 |
10.6 |
14.0 |
12.3 |
14 |
3.7 |
88 |
0.0 |
1018 |
1024 |
1021 |
11.7 |
7.1 |
Sunny ints all day, rain even |
|
20 |
16.1 |
20.1 |
18.1 |
75 |
91 |
83 |
10.6 |
16.6 |
13.6 |
17 |
3.9 |
101 |
5.7 |
1006 |
1018 |
1012 |
13.4 |
0.4 |
Sunny ints am, rain pm |
|
21 |
10.2 |
21.7 |
16.0 |
57 |
92 |
75 |
7.9 |
15.0 |
11.5 |
22 |
4.1 |
99 |
0.4 |
1005 |
1007 |
1006 |
9.1 |
8.3 |
Sunny intervals all day |
|
22 |
10.4 |
23.0 |
16.7 |
56 |
92 |
74 |
7.4 |
14.3 |
10.9 |
14 |
2.1 |
51 |
1.5 |
1006 |
1014 |
1010 |
8.4 |
7.8 |
Sunny intervals all day |
|
23 |
10.5 |
23.1 |
16.8 |
54 |
92 |
73 |
8.2 |
14.2 |
11.2 |
12 |
2.0 |
48 |
0.0 |
1014 |
1023 |
1019 |
10.1 |
3.3 |
Sunny intervals all day |
|
24 |
13.3 |
19.3 |
16.3 |
64 |
89 |
77 |
9.7 |
13.1 |
11.4 |
12 |
2.1 |
45 |
0.0 |
1021 |
1024 |
1023 |
11.2 |
3.5 |
Sunny intervals all day |
|
25 |
15.7 |
24.8 |
20.3 |
53 |
90 |
72 |
12.5 |
15.4 |
14.0 |
16 |
3.8 |
89 |
0.0 |
1017 |
1021 |
1019 |
14.8 |
11.1 |
Sunny intervals all day |
|
26 |
16.8 |
24.9 |
20.9 |
62 |
91 |
77 |
12.7 |
17.4 |
15.1 |
18 |
5.6 |
135 |
0.0 |
1018 |
1019 |
1019 |
13.4 |
6.0 |
Sunny intervals all day |
|
27 |
17.3 |
21.6 |
19.5 |
77 |
90 |
84 |
14.2 |
17.3 |
15.8 |
16 |
3.6 |
87 |
0.0 |
1018 |
1020 |
1019 |
15.4 |
1.4 |
Brief sunny intervals all day |
|
28 |
12.8 |
22.3 |
17.6 |
53 |
91 |
72 |
10.3 |
14.7 |
12.5 |
22 |
5.3 |
127 |
0.0 |
1018 |
1020 |
1019 |
11.2 |
11.8 |
Sunny intervals all day |
|
29 |
9.6 |
21.9 |
15.8 |
55 |
91 |
73 |
6.8 |
13.6 |
10.2 |
19 |
3.8 |
90 |
0.0 |
1017 |
1019 |
1018 |
7.8 |
9.1 |
Sunny intervals all day |
|
30 |
14.1 |
22.3 |
18.2 |
58 |
84 |
71 |
9.7 |
15.4 |
12.6 |
14 |
2.6 |
64 |
0.0 |
1013 |
1018 |
1015 |
15.3 |
1.3 |
Brief sunny intervals all day |
|
31 |
16.6 |
20.8 |
18.7 |
58 |
89 |
74 |
11.2 |
15.1 |
13.2 |
18 |
4.7 |
115 |
0.0 |
1011 |
1014 |
1012 |
13.4 |
2.1 |
Brief sunny intervals all day |
|
|
13.4 |
22.8 |
18.1 |
57 |
90 |
73 |
9.7 |
15.2 |
12.5 |
19 |
4.2 |
3099 |
40.9 |
1013 |
1018 |
1015 |
11.6 |
201.2 |
|
|
|
Graphs for
July 2010 |
 |
|
Figure 1. Temperature and
Rainfall for July 2010. |
 |
|
Figure 2. Sunshine, air
pressure and mean wind speed for July 2010. |
 |
|
Figure 3.
Wind direction for July 2010. |
 |
|
Figure 4. Soil & sea
surface temperature (SST) for Lyme Bay for July 2010. |
 |
|
Figure 5.
Wind run,
maximum gusts and mean pressure for July 2010. |