|
July 2011 |
|
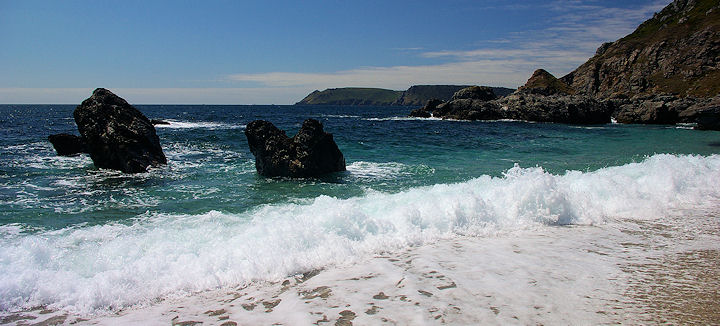
A south Devon beach near East Prawle on
a hot July day. |
|
Summary for |
July
2011 |
|
Mean Max: |
21.7ºC |
(+0.2ºC) |
|
Mean Min: |
11.3ºC |
(-1.0ºC) |
|
Mean: |
16.5ºC |
(-0.4ºC) |
|
|
|
|
|
High Max: |
26.3ºC |
25th |
|
Low Max: |
14.0ºC |
18th |
|
High Min: |
15.4ºC |
28th |
|
Low Min: |
5.8ºC |
1st |
|
Mean Grass Min: |
9.5ºC |
|
|
Grass Min: |
5.6ºC |
1st |
|
|
|
|
|
Rain Total (gauge): |
23.0 mm |
(56%) |
|
Rain Total (tipping bucket): |
23.1 mm |
(57%) |
|
Rain Days >0.2 mm: |
10 Days |
|
|
Rain Days >1.0 mm: |
7 Days |
|
|
Max 24 hrs: |
5.1 mm |
8th |
|
Days without any rain: |
21 |
|
|
|
|
|
|
Air Frost: |
0 Days |
|
|
Ground Frost: |
0 Days |
|
|
Snow Falling: |
0 Days |
|
|
Snow (50%) @ 9am: |
0 Days |
|
|
Thunder Heard: |
0 Days |
|
|
Hail <5 mm: |
0 Days |
|
|
Hail >5 mm: |
0 Days |
|
|
Fog @ 9am: |
0 Days |
|
|
|
|
|
|
Total Monthly Sunshine: |
170h:16m |
|
|
Total Monthly Sunshine: |
170.3 Hours |
(81%) |
|
Most Sunshine in a Day: |
15.8 |
3rd |
|
Average Daily Sunshine: |
05h:29m |
|
|
Sunless Days: |
1 Day |
|
|
Cloudless Days: |
4 Days |
|
|
Total Possible Sunshine: |
495h:38m |
|
|
Percentage of Total Sun: |
34% |
|
|
Maximum UV Index: |
9 |
6th |
|
Average UV Index: |
6.5 |
|
|
|
|
|
|
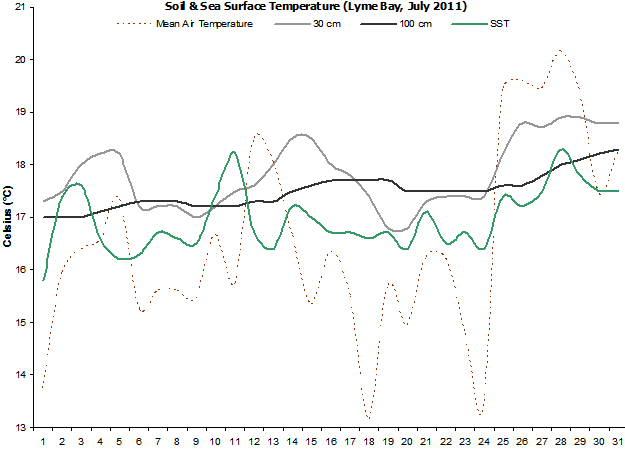
Mean Soil Temp @ 30 cm: |
17.8ºC |
|
|
Min Soil Temp @ 30 cm: |
16.8ºC |
19th |
|
Max Soil Temp @ 30 cm: |
18.9ºC |
28th |
|
Mean Soil Temp @ 100 cm: |
17.5ºC |
|
|
Min Soil Temp @ 100 cm: |
17.0ºC |
1st |
|
Max Soil Temp @ 100 cm: |
18.3ºC |
30th |
|
|
|
|
|
Mean 10 Min Wind >39 mph: |
0.04 Days |
|
|
N: |
3.33 Days |
|
|
NE: |
1.65 Days |
|
|
E: |
1.17 Days |
|
|
SE: |
4.22 Days |
|
|
S: |
4.34 Days |
|
|
SW: |
2.20 Days |
|
|
W: |
3.81 Days |
|
|
NW: |
3.27 Days |
|
|
Calm: |
7.01 Days |
|
|
Wind Chill Low: |
5.2ºC |
1st |
|
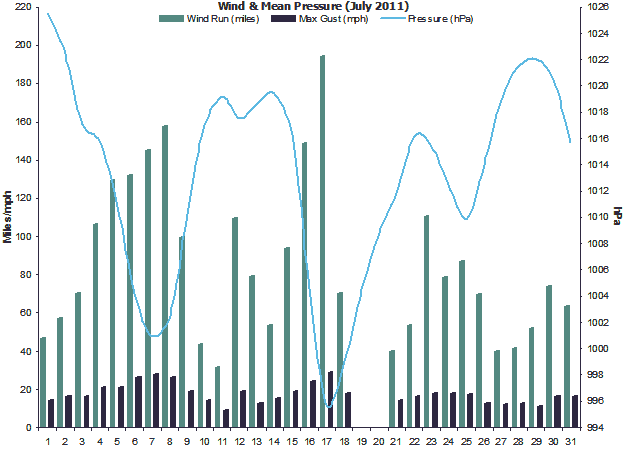
Mean Wind: |
3.6 mph |
|
|
Max Gust: |
29 mph |
17th |
|
|
|
|
|
Mean Cloud Cover: |
68% |
|
|
Mean RH @ 9am: |
82% |
|
|
Rain Duration >0.1mm/hour: |
17.3 Hours |
|
|
Frost Duration: |
0.0 Hours |
|
|
Max Frost Duration in a Day: |
0.0 Hours |
1st |
|
|
|
|
|
Mean Sea Temperature: |
17.0ºC |
(-0.5ºC) |
|
Normal for Month: |
17.5ºC |
|
|
Max Sea Temperature: |
18.3ºC |
28th |
|
Min Sea Temperature: |
15.8ºC |
1st |
|
|
|
|
|
Mean Pressure @ 9am: |
1013.0 hPa |
(-4.8 hPa) |
|
Mean Pressure: |
1013.2 hPa |
(-4.6 hPa) |
|
Max Pressure: |
1027.7 hPa |
1st |
|
Min Pressure: |
993.3 hPa |
17th |
|
|
|
|
|
Max Dewpoint: |
16.1ºC |
29th |
|
Min Dewpoint: |
2.4ºC |
1st |
|
Mean Dewpoint: |
10.3ºC |
|
|
|
|
|
|
Max Humidity: |
92% |
19th |
|
Min Humidity: |
35% |
26th |
|
Mean Humidity: |
72% |
(-4) |
|
|
July continued in the same way as June with generally
unsettled, of then cloudy weather though there were
quite a few warm and sunny days as well.
The
temperatures for July were around the average, though
there were quite a few unusually cool nights early/mid
month. The last week of the month was settled, warm and
fairly sunny. |
|
Rainfall was well below the average and
is the driest July recorded since before 2005. |
|
As would
be expected in a summer month, there were no air or grass frosts.
Unusually no thunder was heard. |
|
Sunshine
levels were rather below the long term average of around 220
hours. This was the dullest June since only 2009,
showing just how dull this month has been since 2007. |
|
Soil temperatures were
slightly above normal at the beginning of the month and continued
this way right through. |
|
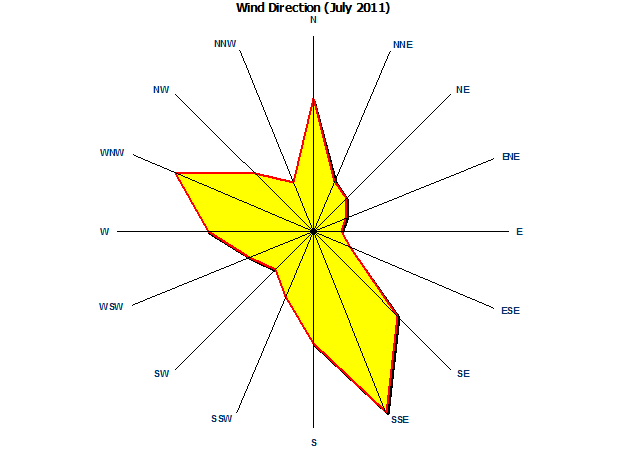
Wind were dominant from
the south or south east sectors, showing the influence
of the sea breeze that blows from these directions. |
|
Rainfall duration was just
17.3 hours,
most of which was in the form of drizzle or patchy light
rain. |
|
Sea surface temperatures
were slightly below normal at the beginning of the month
and generally stayed that way until the last week. They
ended the month rather above normal. |
|
Mean pressure was a little
below the
average for July and indicative of the unsettled nature
of this month. |
|
Dewpoints were a little below
average. |
|
The RH ended up being
below normal due to regular incursions of fairly dry,
cool air. |
|
|
|
Weather Data for Otter Valley, Devon. |
July 2011 |
|
|
|
Temp (oC) |
Hum (RH%) |
Dewpoint (oC) |
Wind (mph) |
Rain |
Pressure (hPa) |
Grass |
Sun |
|
|
|
Min |
Max |
Ave |
Min |
Max |
Ave |
Min |
Max |
Ave |
Max |
Ave |
Run |
mm |
Min |
Max |
Ave |
Min |
Hours |
Observations |
|
1 |
5.8 |
21.7 |
13.8 |
52 |
91 |
72 |
2.4 |
11.2 |
6.8 |
14 |
1.9 |
46 |
0.0 |
1023 |
1028 |
1026 |
5.6 |
7.9 |
Sunny intervals all day |
|
2 |
7.1 |
24.8 |
16.0 |
38 |
90 |
64 |
4.1 |
11.6 |
7.9 |
16 |
2.4 |
57 |
0.0 |
1017 |
1028 |
1022 |
7.1 |
13.8 |
Sunny all day |
|
3 |
7.4 |
25.4 |
16.4 |
36 |
88 |
62 |
3.7 |
10.4 |
7.1 |
16 |
2.9 |
70 |
0.0 |
1016 |
1018 |
1017 |
6.5 |
15.8 |
Sunny all day |
|
4 |
8.7 |
24.4 |
16.6 |
43 |
86 |
65 |
4.6 |
12.2 |
8.4 |
21 |
4.4 |
106 |
0.0 |
1015 |
1017 |
1016 |
8.1 |
7.2 |
Sunny am, cloudy pm |
|
5 |
14.6 |
20.1 |
17.4 |
56 |
86 |
71 |
7.0 |
15.0 |
11.0 |
21 |
5.4 |
130 |
0.0 |
1007 |
1015 |
1011 |
12.3 |
3.0 |
Sunny intervals all day |
|
6 |
11.3 |
19.2 |
15.3 |
55 |
89 |
72 |
8.0 |
11.5 |
9.8 |
26 |
5.5 |
132 |
4.0 |
1001 |
1007 |
1004 |
9.5 |
4.0 |
Sunny ints am, showers pm |
|
7 |
11.1 |
20.1 |
15.6 |
55 |
89 |
72 |
8.6 |
12.2 |
10.4 |
28 |
6.0 |
145 |
2.9 |
1000 |
1002 |
1001 |
9.6 |
3.0 |
Sunny intervals all day |
|
8 |
12.3 |
18.9 |
15.6 |
66 |
90 |
78 |
8.7 |
12.6 |
10.7 |
26 |
6.6 |
158 |
5.1 |
1000 |
1005 |
1002 |
11.6 |
4.0 |
Sunny intervals all day |
|
9 |
10.8 |
20.1 |
15.5 |
56 |
89 |
73 |
7.8 |
11.9 |
9.9 |
19 |
4.1 |
100 |
0.0 |
1005 |
1015 |
1010 |
8.9 |
3.0 |
Sunny intervals all day |
|
10 |
12.2 |
21.1 |
16.7 |
56 |
88 |
72 |
8.4 |
12.4 |
10.4 |
14 |
1.8 |
44 |
0.0 |
1015 |
1019 |
1017 |
9.3 |
13.0 |
Sunny intervals all day |
|
11 |
8.0 |
23.5 |
15.8 |
51 |
91 |
71 |
5.0 |
14.2 |
9.6 |
9 |
1.3 |
32 |
0.0 |
1018 |
1021 |
1019 |
6.4 |
7.0 |
Sunny intervals all day |
|
12 |
14.6 |
22.4 |
18.5 |
57 |
79 |
68 |
9.6 |
13.9 |
11.8 |
19 |
4.6 |
110 |
0.0 |
1016 |
1019 |
1018 |
12.7 |
5.0 |
Sunny intervals all day |
|
13 |
13.1 |
23.0 |
18.1 |
45 |
78 |
62 |
8.3 |
11.4 |
9.9 |
13 |
3.3 |
79 |
0.0 |
1018 |
1020 |
1019 |
9.1 |
6.0 |
Sunny intervals all day |
|
14 |
7.2 |
26.1 |
16.7 |
38 |
91 |
65 |
4.2 |
12.6 |
8.4 |
15 |
2.2 |
54 |
0.0 |
1018 |
1021 |
1019 |
5.8 |
13.0 |
Sunny all day |
|
15 |
9.5 |
21.2 |
15.4 |
61 |
90 |
76 |
5.8 |
13.9 |
9.9 |
19 |
3.9 |
94 |
0.0 |
1012 |
1020 |
1016 |
7.7 |
6.0 |
Sunny am, cloudy pm |
|
16 |
13.9 |
18.8 |
16.4 |
57 |
91 |
74 |
8.9 |
13.8 |
11.4 |
24 |
6.2 |
149 |
2.2 |
997 |
1013 |
1005 |
10.3 |
2.6 |
Rain am, sunny ints pm |
|
17 |
12.6 |
18.4 |
15.5 |
66 |
89 |
78 |
8.4 |
12.2 |
10.3 |
29 |
8.1 |
194 |
1.8 |
993 |
998 |
996 |
10.9 |
0.7 |
Showers am, sunny ints pm |
|
18 |
12.3 |
14.0 |
13.2 |
82 |
90 |
86 |
9.7 |
11.4 |
10.6 |
18 |
2.9 |
70 |
2.6 |
998 |
1000 |
999 |
11.1 |
0.0 |
Cloudy all day |
|
19 |
11.3 |
20.1 |
15.7 |
65 |
92 |
79 |
9.0 |
13.1 |
11.1 |
0 |
0.0 |
0 |
0.7 |
1000 |
1009 |
1004 |
9.9 |
2.3 |
Sunny intervals all day |
|
20 |
12.7 |
17.2 |
15.0 |
73 |
89 |
81 |
9.4 |
12.7 |
11.1 |
0 |
0.0 |
0 |
2.6 |
1008 |
1010 |
1009 |
12.3 |
0.0 |
Cloudy am, sunny ints pm |
|
21 |
10.1 |
22.4 |
16.3 |
53 |
91 |
72 |
7.5 |
12.5 |
10.0 |
14 |
1.7 |
40 |
0.0 |
1009 |
1015 |
1012 |
7.9 |
6.4 |
Sunny intervals all day |
|
22 |
12.8 |
19.6 |
16.2 |
59 |
87 |
73 |
9.9 |
13.1 |
11.5 |
16 |
2.2 |
54 |
0.7 |
1015 |
1018 |
1016 |
7.2 |
4.1 |
Sunny intervals all day |
|
23 |
8.4 |
21.2 |
14.8 |
47 |
91 |
69 |
5.2 |
10.3 |
7.8 |
18 |
4.6 |
111 |
0.0 |
1014 |
1017 |
1015 |
6.5 |
12.8 |
Sunny all day |
|
24 |
7.7 |
19.1 |
13.4 |
67 |
92 |
80 |
4.8 |
14.2 |
9.5 |
18 |
3.6 |
79 |
0.7 |
1010 |
1015 |
1013 |
6.4 |
4.3 |
Sunny intervals all day |
|
25 |
12.6 |
26.3 |
19.5 |
41 |
91 |
66 |
9.8 |
14.0 |
11.9 |
17 |
3.7 |
87 |
0.0 |
1009 |
1011 |
1010 |
10.6 |
4.0 |
Sunny intervals all day |
|
26 |
13.1 |
26.1 |
19.6 |
35 |
79 |
57 |
7.9 |
11.9 |
9.9 |
13 |
2.9 |
70 |
0.0 |
1011 |
1017 |
1014 |
10.5 |
4.3 |
Cloudy am, sunny pm |
|
27 |
13.8 |
25.1 |
19.5 |
52 |
86 |
69 |
7.6 |
15.2 |
11.4 |
12 |
1.7 |
40 |
0.0 |
1017 |
1021 |
1019 |
10.5 |
3.8 |
Sunny intervals all day |
|
28 |
15.4 |
24.9 |
20.2 |
47 |
85 |
66 |
11.7 |
14.6 |
13.2 |
13 |
1.7 |
41 |
0.0 |
1021 |
1022 |
1021 |
14.9 |
4.1 |
Sunny intervals all day |
|
29 |
15.1 |
23.6 |
19.4 |
62 |
88 |
75 |
11.5 |
16.1 |
13.8 |
11 |
2.1 |
52 |
0.0 |
1021 |
1023 |
1022 |
13.8 |
0.5 |
Cloudy am, sunny ints pm |
|
30 |
12.7 |
22.2 |
17.5 |
62 |
91 |
77 |
9.6 |
14.4 |
12.0 |
16 |
3.1 |
74 |
0.0 |
1019 |
1022 |
1020 |
11.0 |
5.2 |
Sunny intervals all day |
|
31 |
13.3 |
23.2 |
18.3 |
65 |
91 |
78 |
9.6 |
16.1 |
12.9 |
16 |
3.3 |
64 |
0.0 |
1012 |
1019 |
1016 |
10.2 |
3.5 |
Sunny intervals all day |
|
|
11.3 |
21.7 |
16.5 |
55 |
88 |
72 |
7.6 |
13.0 |
10.3 |
18 |
3.6 |
2476 |
23.1 |
1011 |
1015 |
1013 |
9.5 |
170.3 |
|
Graphs for
July 2011 |
 |
|
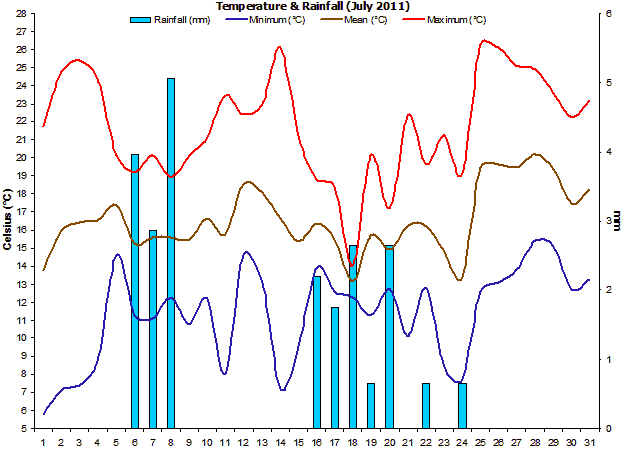
Figure 1. Temperature and
Rainfall for July 2011. |
 |
|
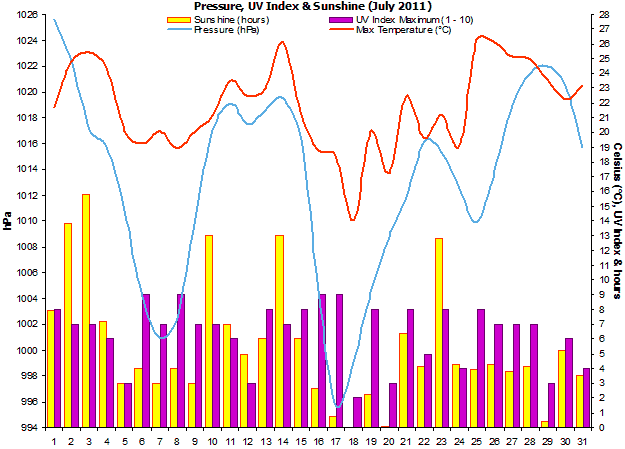
Figure 2. Sunshine, air
pressure and mean wind speed for July 2011. |
 |
|
Figure 3.
Wind direction for July 2011. |
 |
|
Figure 4. Soil & sea
surface temperature (SST) for Lyme Bay for July 2011. |
 |
|
Figure 5.
Wind run,
maximum gusts and mean pressure for July 2011. |
|