|
Summary for |
May
2011 |
|
Mean Max: |
17.4ºC |
(+1.4ºC) |
|
Mean Min: |
8.0ºC |
(+0.7ºC) |
|
Mean: |
12.7ºC |
(+1.0ºC) |
|
|
|
|
|
High Max: |
20.9ºC |
6th |
|
Low Max: |
14.8ºC |
4th |
|
High Min: |
13.3ºC |
30th |
|
Low Min: |
3.1ºC |
13th |
|
Mean Grass Min: |
5.6ºC |
|
|
Grass Min: |
1.7ºC |
25th |
|
|
|
|
|
Rain Total (gauge): |
42.4 mm |
(75%) |
|
Rain Total (tipping bucket): |
39.8 mm |
(70%) |
|
Rain Days >0.2 mm: |
10 Days |
|
|
Rain Days >1.0 mm: |
7 Days |
|
|
Max 24 hrs: |
11.2 mm |
8th |
|
Days without any rain: |
21 |
|
|
|
|
|
|
Air Frost: |
0 Days |
|
|
Ground Frost: |
0 Days |
|
|
Snow Falling: |
0 Days |
|
|
Snow (50%) @ 9am: |
0 Days |
|
|
Thunder Heard: |
3 Days |
|
|
Hail <5 mm: |
0 Days |
|
|
Hail >5 mm: |
0 Days |
|
|
Fog @ 9am: |
0 Days |
|
|
|
|
|
|
Total Monthly Sunshine: |
172h:33m |
|
|
Total Monthly Sunshine: |
172.6 Hours |
(88%) |
|
Most Sunshine in a Day: |
12.8 |
27th |
|
Average Daily Sunshine: |
05h:34m |
|
|
Sunless Days: |
1 Days |
|
|
Cloudless Days: |
7 Days |
|
|
Total Possible Sunshine: |
480h:58m |
|
|
Percentage of Total Sun: |
36% |
|
|
Maximum UV Index: |
9 |
29th |
|
Average Daily UV Index: |
6.5 |
|
|
|
|
|
|
Mean Soil Temp @ 30 cm: |
14.8ºC |
|
|
Min Soil Temp @ 30 cm: |
14.0ºC |
5th |
|
Max Soil Temp @ 30 cm: |
15.6ºC |
11th |
|
Mean Soil Temp @ 100 cm: |
14.9ºC |
|
|
Min Soil Temp @ 100 cm: |
14.6ºC |
4th |
|
Max Soil Temp @ 100 cm: |
15.1ºC |
21st |
|
|
|
|
|
Mean 10 Min Wind >39 mph: |
0.00 Days |
|
|
N: |
0.33 Days |
|
|
NE: |
2.03 Days |
|
|
E: |
2.58 Days |
|
|
SE: |
4.90 Days |
|
|
S: |
4.09 Days |
|
|
SW: |
3.74 Days |
|
|
W: |
8.41 Days |
|
|
NW: |
3.31 Days |
|
|
Calm: |
1.60 Days |
|
|
Wind Chill Low: |
2.3ºC |
25th |
|
Mean Wind: |
5.9 mph |
|
|
Max Gust: |
34 mph |
23rd |
|
|
|
|
|
Mean Cloud Cover: |
58% |
|
|
Mean RH @ 9am: |
81% |
|
|
Rain Duration >0.1mm/hour: |
16.8 Hours |
|
|
Frost Duration: |
0.0 Hours |
|
|
Max Frost Duration in a Day: |
0.0 Hours |
1st |
|
|
|
|
|
Mean Sea Temperature: |
12.8ºC |
|
|
Normal for Month: |
|
|
|
Max Sea Temperature: |
13.9ºC |
11th |
|
Min Sea Temperature: |
11.6ºC |
2nd |
|
|
|
|
|
Mean Pressure @ 9am: |
1017.8 hPa |
(+2.0 hPa) |
|
Mean Pressure: |
1017.3 hPa |
(+1.5 hPa) |
|
Max Pressure: |
1028.9 hPa |
25th |
|
Min Pressure: |
1004.6 hPa |
1st |
|
|
|
|
|
Max Dewpoint: |
13.7ºC |
7th |
|
Min Dewpoint: |
-0.6ºC |
25th |
|
Mean Dewpoint: |
7.0ºC |
|
|
|
|
|
|
Max Humidity: |
92% |
8th |
|
Min Humidity: |
41% |
3rd |
|
Mean Humidity: |
72% |
(-5) |
|
|
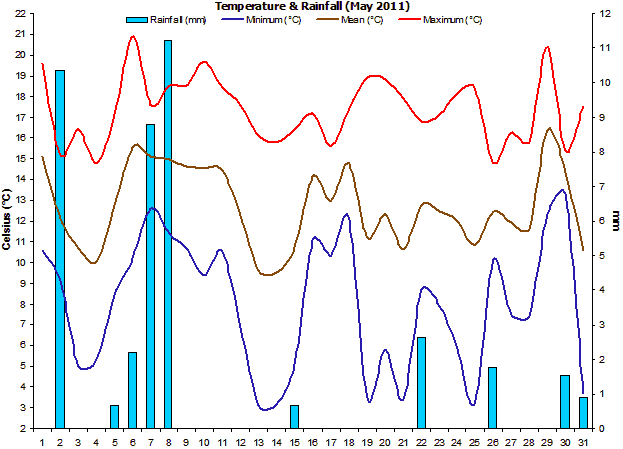
After a stunningly sunny, warm and dry April, this month
was more 'normal'.
Despite a
generally breezy and often cloudy month, May ended up
warmer and drier than average. There were no warm days
(>21°C) which has never happened before in the station
record as May normally would have quite a few 'hot'
days. |
|
Rainfall was below the average and
continued the dry theme of Spring 2011. |
|
As would
be expected in May, there were no air or grass frosts.
Thunderstorms made a welcome return after a very long,
unthundery period. |
|
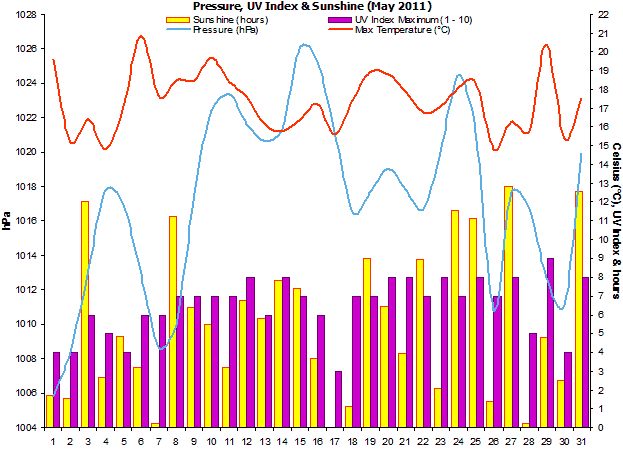
Sunshine
levels were below the long term average of around 200
hours. This was the dullest May since 2007. UV levels
were exceptionally high towards the end of May. |
|
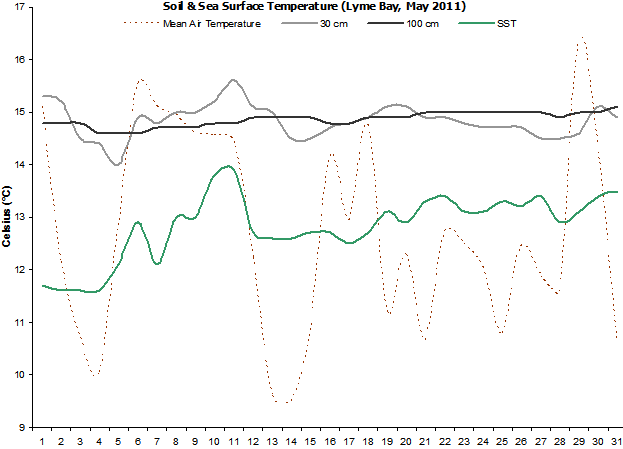
Soil temperatures were
above normal at the beginning of the month and continued
this way right through. |
|
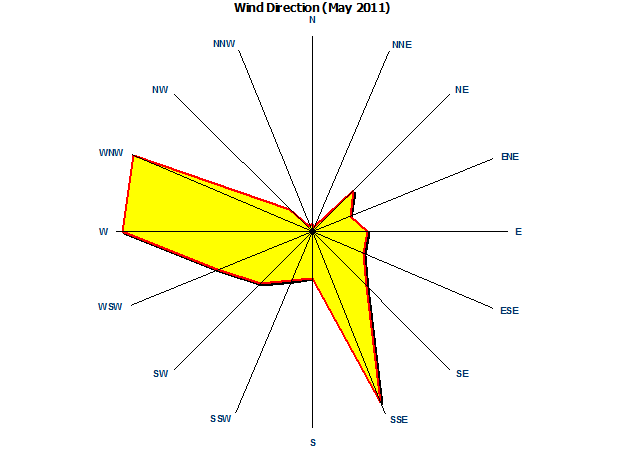
Winds were dominant from
the west to north-westerly directions and the mean wind
speed of 5.9 mph is very high for May. It was the
windiest month since March 2008. |
|
Rainfall duration was only
16.8 hours due to it falling in short, sharp periods
from thunderstorms. |
|
Sea surface temperatures
were above normal at the beginning of the month but
generally fell back to normal at the end. |
|
Mean pressure was a little above the
average for May. |
|
Dewpoints were rather
below
average. |
|
The RH ended up being
well below normal due to regular incursions of dry air. |
|
|
|
Weather Data for Otter Valley, Devon. |
May 2011 |
|
|
|
Temp (oC) |
Hum (RH%) |
Dewpoint (oC) |
Wind (mph) |
Rain |
Pressure (hPa) |
Grass |
Sun |
|
|
|
Min |
Max |
Ave |
Min |
Max |
Ave |
Min |
Max |
Ave |
Max |
Ave |
Run |
mm |
Min |
Max |
Ave |
Min |
Hours |
Observations |
|
1 |
10.6 |
19.6 |
15.1 |
57 |
82 |
70 |
6.4 |
11.6 |
9.0 |
24 |
8.1 |
192 |
0.0 |
1005 |
1007 |
1006 |
8.3 |
1.7 |
Brief sunny intervals all day |
|
2 |
9.1 |
15.2 |
12.2 |
51 |
84 |
68 |
3.1 |
8.1 |
5.6 |
24 |
7.0 |
168 |
10.3 |
1007 |
1010 |
1008 |
8.3 |
1.5 |
Brief sunny intervals all day |
|
3 |
5.0 |
16.4 |
10.7 |
41 |
83 |
62 |
0.4 |
6.3 |
3.4 |
23 |
7.4 |
177 |
0.0 |
1010 |
1017 |
1013 |
2.8 |
12.0 |
Sunny intervals all day |
|
4 |
5.3 |
14.8 |
10.1 |
48 |
78 |
63 |
-0.5 |
6.6 |
3.1 |
23 |
5.6 |
135 |
0.0 |
1017 |
1019 |
1018 |
3.0 |
2.6 |
Brief sunny intervals all day |
|
5 |
8.4 |
17.1 |
12.8 |
61 |
86 |
74 |
3.0 |
12.1 |
7.6 |
18 |
5.2 |
125 |
0.7 |
1015 |
1019 |
1017 |
6.0 |
4.8 |
Sunny ints all day |
|
6 |
10.2 |
20.9 |
15.6 |
51 |
89 |
70 |
6.3 |
13.1 |
9.7 |
22 |
3.8 |
91 |
2.2 |
1011 |
1015 |
1013 |
7.5 |
3.2 |
Sunny ints, thunder evening |
|
7 |
12.6 |
17.6 |
15.1 |
76 |
90 |
83 |
9.3 |
13.7 |
11.5 |
28 |
6.7 |
162 |
8.8 |
1006 |
1011 |
1009 |
9.9 |
0.2 |
Sunny, thunder evening |
|
8 |
11.4 |
18.5 |
15.0 |
60 |
92 |
76 |
8.3 |
12.0 |
10.2 |
30 |
9.8 |
236 |
11.2 |
1005 |
1015 |
1010 |
9.2 |
11.2 |
Sunny intervals all day |
|
9 |
10.7 |
18.5 |
14.6 |
66 |
91 |
79 |
7.7 |
12.0 |
9.9 |
28 |
8.7 |
210 |
0.0 |
1015 |
1020 |
1018 |
9.2 |
6.4 |
Sunny intervals all day |
|
10 |
9.4 |
19.7 |
14.6 |
54 |
92 |
73 |
6.7 |
12.0 |
9.4 |
22 |
5.5 |
132 |
0.0 |
1020 |
1025 |
1022 |
6.7 |
5.5 |
Sunny intervals all day |
|
11 |
10.5 |
18.4 |
14.5 |
51 |
89 |
70 |
5.4 |
10.1 |
7.8 |
18 |
3.2 |
76 |
0.0 |
1022 |
1025 |
1023 |
2.8 |
3.2 |
Sunny intervals all day |
|
12 |
6.9 |
17.6 |
12.3 |
52 |
88 |
70 |
2.7 |
8.7 |
5.7 |
21 |
4.9 |
119 |
0.0 |
1021 |
1023 |
1022 |
4.3 |
6.8 |
Sunny intervals all day |
|
13 |
3.1 |
16.1 |
9.6 |
58 |
91 |
75 |
0.2 |
8.9 |
4.6 |
18 |
2.6 |
62 |
0.0 |
1018 |
1023 |
1021 |
2.7 |
5.8 |
Sunny intervals all day |
|
14 |
3.2 |
15.8 |
9.5 |
54 |
91 |
73 |
0.4 |
8.2 |
4.3 |
23 |
5.3 |
126 |
0.0 |
1019 |
1024 |
1021 |
2.1 |
7.8 |
Sunny intervals all day |
|
15 |
5.1 |
16.4 |
10.8 |
51 |
89 |
70 |
1.5 |
7.8 |
4.7 |
22 |
5.8 |
140 |
0.7 |
1024 |
1028 |
1026 |
2.7 |
7.4 |
Sunny intervals all day |
|
16 |
11.1 |
17.2 |
14.2 |
64 |
86 |
75 |
6.7 |
10.3 |
8.5 |
27 |
8.1 |
195 |
0.0 |
1023 |
1027 |
1025 |
9.1 |
3.7 |
Sunny intervals all day |
|
17 |
10.3 |
15.6 |
13.0 |
72 |
86 |
79 |
6.3 |
11.1 |
8.7 |
19 |
4.8 |
116 |
0.0 |
1019 |
1024 |
1021 |
8.9 |
0.0 |
Cloudy all day |
|
18 |
12.1 |
17.4 |
14.8 |
61 |
89 |
75 |
6.2 |
12.7 |
9.5 |
22 |
4.5 |
107 |
0.0 |
1014 |
1019 |
1017 |
12.2 |
1.1 |
Cloudy am, sunny ints pm |
|
19 |
3.5 |
18.9 |
11.2 |
45 |
91 |
68 |
0.7 |
7.7 |
4.2 |
14 |
2.4 |
57 |
0.0 |
1016 |
1020 |
1018 |
2.2 |
9.0 |
Sunny intervals all day |
|
20 |
5.8 |
18.8 |
12.3 |
54 |
88 |
71 |
2.2 |
10.1 |
6.2 |
19 |
3.0 |
77 |
0.0 |
1018 |
1020 |
1019 |
3.8 |
6.4 |
Sunny intervals all day |
|
21 |
3.4 |
17.9 |
10.7 |
63 |
91 |
77 |
0.5 |
10.8 |
5.7 |
22 |
5.3 |
127 |
0.0 |
1014 |
1021 |
1018 |
2.3 |
4.0 |
Sunny intervals all day |
|
22 |
8.7 |
16.8 |
12.8 |
49 |
87 |
68 |
5.0 |
10.5 |
7.8 |
31 |
8.8 |
210 |
2.6 |
1012 |
1022 |
1017 |
5.9 |
9.0 |
Sunny intervals all day |
|
23 |
7.9 |
17.1 |
12.5 |
65 |
88 |
77 |
3.9 |
11.0 |
7.5 |
34 |
6.7 |
160 |
0.0 |
1017 |
1023 |
1020 |
5.6 |
2.1 |
Sunny ints am, cloudy pm, |
|
24 |
6.0 |
18.1 |
12.1 |
42 |
84 |
63 |
2.5 |
6.6 |
4.6 |
18 |
5.8 |
128 |
0.0 |
1021 |
1028 |
1024 |
3.8 |
11.5 |
Sunny intervals all day |
|
25 |
3.2 |
18.4 |
10.8 |
52 |
90 |
71 |
-0.6 |
9.8 |
4.6 |
23 |
5.3 |
125 |
0.0 |
1013 |
1029 |
1021 |
1.7 |
11.1 |
Sunny intervals all day |
|
26 |
10.1 |
14.8 |
12.5 |
71 |
89 |
80 |
6.1 |
9.6 |
7.9 |
34 |
8.6 |
207 |
1.8 |
1007 |
1015 |
1011 |
6.0 |
1.4 |
Showers am, sunny ints pm |
|
27 |
7.5 |
16.3 |
11.9 |
48 |
84 |
66 |
4.0 |
5.9 |
5.0 |
22 |
7.1 |
172 |
0.0 |
1015 |
1021 |
1018 |
5.1 |
12.8 |
Sunny intervals all day |
|
28 |
7.4 |
15.8 |
11.6 |
65 |
84 |
75 |
3.1 |
10.8 |
7.0 |
21 |
5.1 |
121 |
0.0 |
1013 |
1020 |
1017 |
5.8 |
0.2 |
Brief sunny intervals all day |
|
29 |
12.3 |
20.4 |
16.4 |
62 |
85 |
74 |
9.0 |
12.6 |
10.8 |
21 |
5.8 |
138 |
0.0 |
1012 |
1014 |
1013 |
9.6 |
4.8 |
Cloudy am, sunny ints pm |
|
30 |
13.3 |
15.4 |
14.4 |
60 |
91 |
76 |
4.8 |
11.8 |
8.3 |
20 |
5.6 |
135 |
1.5 |
1009 |
1013 |
1011 |
4.3 |
2.5 |
Drizzle am, sunny ints pm |
|
31 |
3.7 |
17.5 |
10.6 |
49 |
90 |
70 |
0.9 |
7.2 |
4.1 |
21 |
5.7 |
139 |
0.9 |
1013 |
1027 |
1020 |
2.4 |
12.6 |
Sunny intervals all day |
|
|
8.0 |
17.4 |
12.7 |
57 |
88 |
72 |
3.9 |
10.0 |
7.0 |
23 |
5.9 |
4364 |
39.8 |
1015 |
1020 |
1017 |
5.6 |
172.6 |
|
Graphs for May 2011 |
 |
|
Figure 1. Temperature and
Rainfall for May 2011. |
 |
|
Figure 2. Sunshine, air
pressure and mean wind speed for May 2011. |
 |
|
Figure 3.
Wind direction for May 2011. |
 |
|
Figure 4. Soil & sea
surface temperature (SST) for Lyme Bay for May 2011. |
 |
|
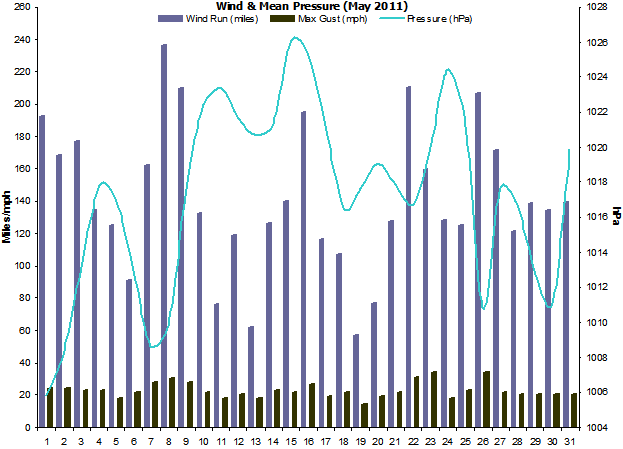
Figure 5.
Wind run,
maximum gusts and mean pressure for May 2011. |