|
December 2012 |
|
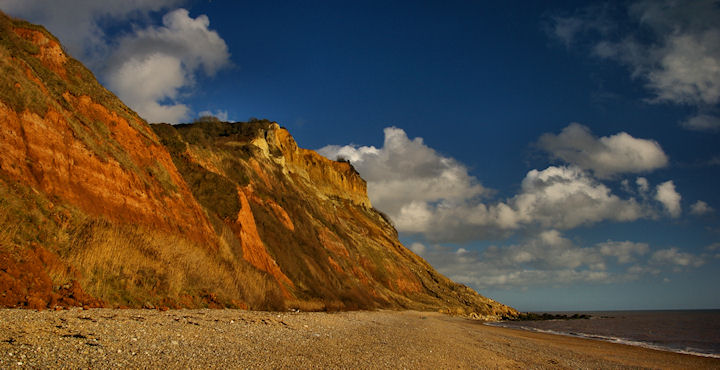
The cliffs east of Sidmouth, basking in
December sunshine. |
|
Summary for |
December
2012 |
|
Mean Max: |
9.8ºC |
(+0.5ºC) |
|
Mean Min: |
3.8ºC |
(+0.5ºC) |
|
Mean: |
6.8ºC |
(+0.5ºC) |
|
|
|
|
|
High Max: |
13.4ºC |
22nd |
|
Low Max: |
4.7ºC |
11th |
|
High Min: |
9.3ºC |
23rd |
|
Low Min: |
-2.9ºC |
11th |
|
Mean Grass Min: |
0.5ºC |
|
|
Grass Min: |
-5.3ºC |
11th |
|
|
|
|
|
Rain Total (gauge): |
171.5 mm |
(191%) |
|
Rain Total (tipping bucket): |
168.3 mm |
(187%) |
|
Rain Days >0.2 mm: |
23 Days |
|
|
Rain Days >1.0 mm: |
21 Days |
|
|
Max 24 hrs: |
29.3 mm |
22nd |
|
Days without any rain: |
8 |
|
|
|
|
|
|
Air Frost: |
5 Days |
|
|
Grass Frost: |
16 Days |
|
|
Snow Falling: |
0 Days |
|
|
Snow (50%) @ 9am: |
0 Days |
|
|
Ice Days: |
0 Days |
|
|
Thunder Heard: |
1 Day |
|
|
Hail <5 mm: |
1 Day |
|
|
Hail >5 mm: |
0 Days |
|
|
Fog @ 9am: |
0 Days |
|
|
|
|
|
|
Total Monthly Sunshine: |
82.6 Hours |
(141%) |
|
Most Sunshine in a Day: |
7.5 Hours |
8th |
|
Average Daily Sunshine: |
2.7 Hours |
|
|
Sunless Days: |
9 Days |
|
|
Cloudless Days: |
4 Days |
|
|
Total Possible Sunshine: |
249.6 Hours |
|
|
Percentage of Total Sun: |
33% |
|
|
Maximum UV Index: |
0.9 |
8th |
|
Time of Max UV: |
|
12:00 |
|
|
|
|
|
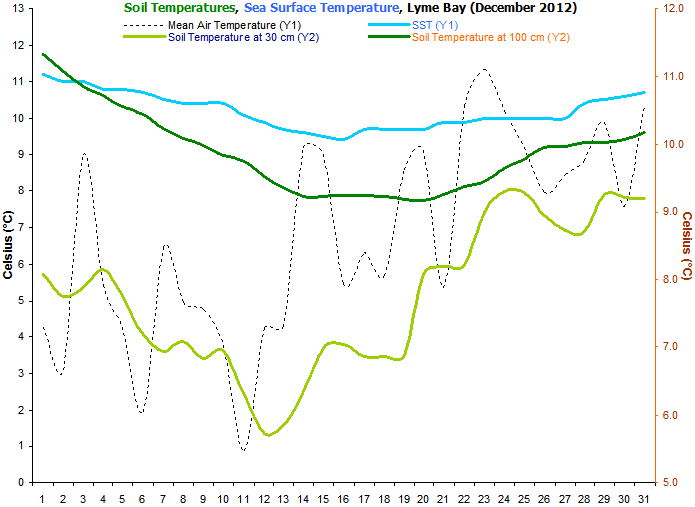
Mean Soil Temp @ 30 cm: |
7.7ºC |
|
|
Min Soil Temp @ 30 cm: |
5.7ºC |
12th |
|
Max Soil Temp @ 30 cm: |
9.3ºC |
24th |
|
Mean Soil Temp @ 100 cm: |
9.9ºC |
|
|
Min Soil Temp @ 100 cm: |
9.2ºC |
20th |
|
Max Soil Temp @ 100 cm: |
11.3ºC |
1st |
|
|
|
|
|
Mean 10 Min Wind >39 mph: |
0.01 Days |
|
|
N: |
4.05 Days |
|
|
NE: |
0.47 Days |
|
|
E: |
2.11 Days |
|
|
SE: |
2.08 Days |
|
|
S: |
6.56 Days |
|
|
SW: |
5.95 Days |
|
|
W: |
1.29 Days |
|
|
NW: |
4.66 Days |
|
|
Calm: |
3.83 Days |
|
|
Wind Chill Low: |
-4.2ºC |
11th |
|
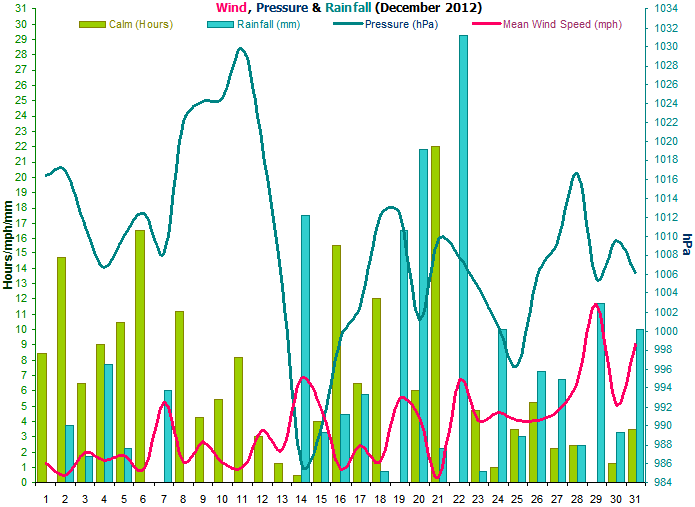
Mean Wind: |
3.6 mph |
|
|
Max Gust: |
40 mph |
29th |
|
|
ys |
|
|
Mean Cloud Cover: |
70% |
|
|
Mean RH @ 9am: |
94% |
|
|
Rain Duration >0.1mm/hour: |
96.8 Hours |
|
|
Frost Duration: |
47.5 Hours |
|
|
Max Frost Duration in a Day: |
14.8 Hours |
11th |
|
|
|
|
|
Mean Sea Temperature: |
10.2ºC |
(+0.4ºC) |
|
Normal for Month: |
9.8ºC |
|
|
Max Sea Temperature: |
11.2ºC |
1st |
|
Min Sea Temperature: |
9.4ºC |
16th |
|
|
|
|
|
Mean Pressure @ 9am: |
1008.7 hPa |
(-5.9 hPa) |
|
Mean Pressure: |
1009.1 hPa |
(-5.5 hPa) |
|
Max Pressure: |
1031.8 hPa |
11th |
|
Min Pressure: |
974.3 hPa |
14th |
|
Max Change in 24 hours: |
23.6 hPa |
14th |
|
|
|
|
|
Radiation Daily Mean: |
2.6 MJ/m² |
|
|
Max Daily Value: |
5.8 MJ/m² |
1st |
|
Min Daily Value: |
0.5 MJ/m² |
31st |
|
Number of Days with Data: |
31 Days |
|
|
1-Hour Maximum: |
363 W/m² |
25th |
|
Starting Time of the Hour: |
|
12:00 |
|
|
|
|
|
Max Dewpoint: |
12.9ºC |
22nd |
|
Min Dewpoint: |
-3.9ºC |
11th |
|
Mean Dewpoint: |
5.0ºC |
|
|
|
|
|
|
Max Humidity: |
100% |
21st |
|
Min Humidity: |
66% |
5th |
|
Mean Humidity: |
90% |
(+3) |
|
|
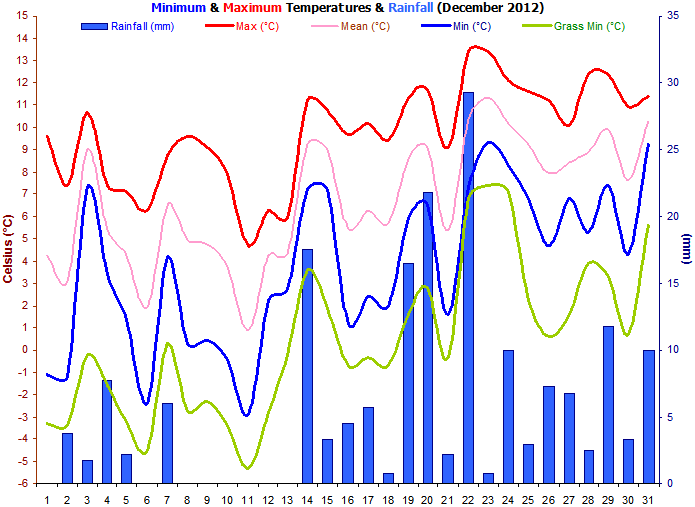
A generally
mild (especially by day) and very wet month, though
there were a few sharp frosts at first. No air frosts
since the 11th and extremely mild both day and night
from the 22nd onwards.
Temperatures were a little below normal until the 14th,
but then things turned much warmer and the frosts
disappeared. Very mild nights for the last 10 days of
the month. |
|
Another extremely wet
month, keeping the trend of wetter than average months
going that started in June. The Otter Valley did not
receive as much rainfall as other parts of Devon &
Cornwall, probably due to the rainfall shadow effect of
Dartmoor in a SW airstream. |
|
December
often sees a few air frosts and this
year was no exception. Though from the 11th onwards the
nights remained mild and frost-free. The cold air that
affected many parts of England did not reach here and
hence no snow was seen falling or lying. There was a
thunderstorm with hail at midday on the 16th. Unusually
for December, there were no foggy mornings. |
|
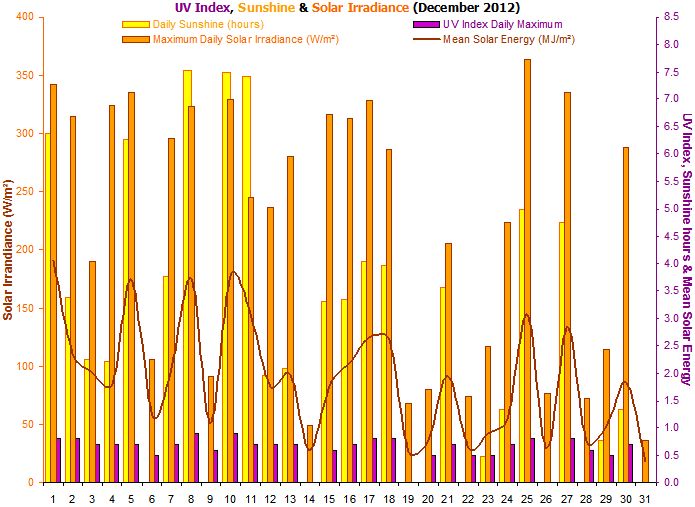
Sunshine
amounts were above average despite a high amount of
cloud during the 2nd half of the month. This was due to
a run of very sunny days during the first and second
weeks with sunshine levels attaining up to 70% of the
total possible for this time. |
|
Soil temperatures slowly
declined through to mid-month but then rose again. 30 cm
soil temperatures actually peaked during the 4th week of
the month. |
|
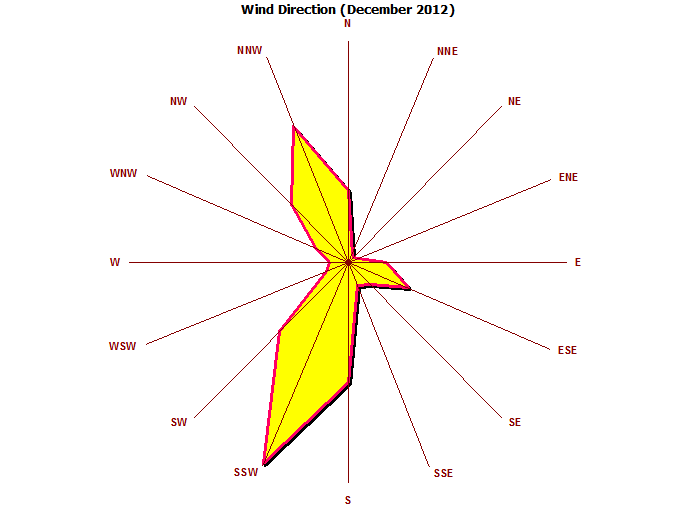
Overall this was quite a
breezy month but that is not unusual for December. There
were no high wind speeds though overnight on the 29th,
gusts did reach 40 mph (60 kph). Winds were dominant
from the south and south-westerly directions. |
|
The rainfall duration of
97 hours and reflects the high amount of rainfall
that actually fell during this month. |
|
Sea surface temperatures
fell sharply during the cold nights of the first and
second weeks, but then rose again with the warmer
conditions from the 11th onwards. |
|
Mean pressure was rather
below the average for December and indicative of the
very unsettled conditions that dominated this month. |
|
A new sensor has been
added that measures solar irradiance in watts per square
metre falling on a horizontal surface. |
|
Dewpoints were above
the average. |
|
Relative humidity was
a little above normal. |
|
|
|
Weather Data for Otter Valley, Devon. |
December 2012 |
|
|
|
Temp oC |
Grass |
Hum (%) |
Soil oC |
DP (oC) |
Wind (mph) |
Rain |
Air (hPa) |
W/m² |
UV |
Sun |
|
|
|
Min |
Max |
Min |
Min |
Max |
30 |
100 |
Min |
Max |
Max |
Ave |
Run |
mm |
Min |
Max |
Max |
Max |
Hours |
Observations |
|
1 |
-1.1 |
9.6 |
-3.3 |
79 |
99 |
8.1 |
11.3 |
-1.9 |
6.5 |
16 |
1.3 |
30 |
0.0 |
1015 |
1018 |
342 |
0.8 |
6.4 |
Sunny all day |
|
2 |
-1.2 |
7.4 |
-3.4 |
87 |
99 |
7.7 |
11.1 |
-2.0 |
6.9 |
9 |
0.5 |
12 |
3.8 |
1015 |
1019 |
315 |
0.8 |
3.4 |
Sunny ints am, cloudy pm |
|
3 |
7.3 |
10.7 |
-0.2 |
80 |
99 |
7.9 |
10.9 |
2.4 |
10.6 |
17 |
2.0 |
48 |
1.8 |
1007 |
1015 |
190 |
0.7 |
2.3 |
Sunny intervals all day |
|
4 |
3.4 |
7.4 |
-1.6 |
82 |
98 |
8.2 |
10.7 |
0.0 |
5.0 |
15 |
1.5 |
36 |
7.8 |
1005 |
1009 |
324 |
0.7 |
2.2 |
Sun and showers all day |
|
5 |
1.4 |
7.1 |
-3.2 |
66 |
99 |
7.8 |
10.5 |
-1.3 |
4.1 |
16 |
1.8 |
43 |
2.3 |
1003 |
1018 |
335 |
0.7 |
6.3 |
Sunny intervals all day |
|
6 |
-2.4 |
6.3 |
-4.5 |
85 |
99 |
7.2 |
10.4 |
-3.3 |
4.4 |
18 |
1.0 |
23 |
0.0 |
1006 |
1019 |
106 |
0.5 |
0.0 |
Cloudy all day |
|
7 |
4.2 |
8.7 |
0.3 |
75 |
94 |
7.0 |
10.2 |
2.0 |
6.2 |
22 |
5.3 |
127 |
6.0 |
1001 |
1016 |
296 |
0.7 |
3.8 |
Sunny intervals all day |
|
8 |
0.3 |
9.6 |
-2.7 |
72 |
98 |
7.1 |
10.1 |
-1.0 |
5.1 |
16 |
1.4 |
34 |
0.0 |
1016 |
1028 |
323 |
0.9 |
7.5 |
Sunny all day |
|
9 |
0.4 |
9.1 |
-2.3 |
86 |
99 |
6.8 |
10.0 |
-1.1 |
7.2 |
16 |
2.7 |
65 |
0.0 |
1020 |
1028 |
91 |
0.6 |
0.0 |
Cloudy all day |
|
10 |
-0.4 |
7.9 |
-3.4 |
71 |
99 |
7.0 |
9.8 |
-1.4 |
5.0 |
12 |
1.3 |
32 |
0.0 |
1020 |
1029 |
329 |
0.9 |
7.5 |
Sunny all day |
|
11 |
-2.9 |
4.7 |
-5.3 |
79 |
98 |
6.3 |
9.8 |
-3.9 |
1.9 |
6 |
1.0 |
24 |
0.0 |
1028 |
1032 |
245 |
0.7 |
7.4 |
Sunny all day |
|
12 |
2.2 |
6.3 |
-2.8 |
67 |
93 |
5.7 |
9.5 |
-1.6 |
2.0 |
21 |
3.4 |
82 |
0.0 |
1012 |
1028 |
237 |
0.7 |
2.0 |
Sunny intervals all day |
|
13 |
2.7 |
5.9 |
-0.2 |
77 |
92 |
5.8 |
9.4 |
0.0 |
3.4 |
12 |
2.2 |
53 |
0.0 |
998 |
1011 |
280 |
0.7 |
2.1 |
Sunny ints am, cloudy pm |
|
14 |
7.2 |
11.2 |
3.6 |
88 |
98 |
6.3 |
9.2 |
3.8 |
10.7 |
28 |
6.8 |
163 |
17.5 |
974 |
998 |
49 |
0.0 |
0.0 |
Rain am, showers pm |
|
15 |
7.2 |
10.8 |
1.9 |
87 |
97 |
7.0 |
9.2 |
5.0 |
9.2 |
20 |
4.8 |
115 |
3.3 |
983 |
997 |
317 |
0.6 |
3.3 |
Sun and showers all day |
|
16 |
1.2 |
9.7 |
-0.7 |
90 |
99 |
7.0 |
9.2 |
0.8 |
8.8 |
16 |
0.9 |
23 |
4.5 |
997 |
1002 |
313 |
0.7 |
3.3 |
Sun & showers. |
|
17 |
2.4 |
10.2 |
-0.3 |
79 |
99 |
6.9 |
9.2 |
1.8 |
7.1 |
15 |
2.5 |
60 |
5.8 |
999 |
1007 |
328 |
0.8 |
4.0 |
Sunny intervals all day |
|
18 |
2.0 |
9.4 |
-0.7 |
84 |
99 |
6.9 |
9.2 |
1.3 |
7.8 |
19 |
1.4 |
33 |
0.8 |
1006 |
1019 |
286 |
0.8 |
4.0 |
Sunny intervals all day |
|
19 |
5.9 |
11.3 |
1.6 |
88 |
99 |
6.9 |
9.2 |
2.7 |
11.1 |
23 |
5.5 |
131 |
16.5 |
1007 |
1018 |
68 |
0.0 |
0.0 |
Rain and drizzle all day |
|
20 |
6.5 |
11.7 |
2.8 |
95 |
99 |
8.1 |
9.2 |
6.0 |
11.5 |
27 |
4.3 |
111 |
21.8 |
996 |
1007 |
80 |
0.5 |
0.0 |
Rain and drizzle all day |
|
21 |
1.6 |
9.1 |
-0.3 |
97 |
100 |
8.2 |
9.3 |
1.2 |
9.1 |
15 |
0.3 |
8 |
2.3 |
1004 |
1015 |
205 |
0.7 |
3.6 |
Sunny ints, rain evening. |
|
22 |
7.3 |
13.4 |
6.8 |
94 |
100 |
8.2 |
9.4 |
8.0 |
12.9 |
22 |
6.7 |
160 |
29.3 |
1002 |
1014 |
75 |
0.5 |
0.0 |
Rain, intermittent all day |
|
23 |
9.3 |
13.4 |
7.4 |
84 |
97 |
9.0 |
9.4 |
7.3 |
12.4 |
24 |
4.1 |
98 |
0.8 |
1002 |
1007 |
117 |
0.5 |
0.5 |
Sunny ints am, cloudy pm |
|
24 |
8.3 |
12.1 |
7.1 |
87 |
99 |
9.3 |
9.6 |
7.7 |
11.5 |
32 |
4.6 |
101 |
10.0 |
994 |
1007 |
224 |
0.7 |
1.3 |
Rain am, sunny intervals pm |
|
25 |
6.8 |
11.6 |
2.2 |
74 |
98 |
9.3 |
9.8 |
4.9 |
8.2 |
25 |
4.1 |
97 |
3.0 |
990 |
1003 |
363 |
0.8 |
5.0 |
Sunny intervals all day |
|
26 |
4.7 |
11.2 |
0.6 |
82 |
98 |
8.9 |
9.9 |
3.8 |
10.3 |
23 |
4.1 |
98 |
7.3 |
1002 |
1010 |
76 |
0.0 |
0.0 |
Cloudy am, rain pm |
|
27 |
6.8 |
10.1 |
1.6 |
77 |
96 |
8.7 |
10.0 |
4.4 |
7.9 |
28 |
4.7 |
112 |
6.8 |
999 |
1020 |
335 |
0.8 |
4.8 |
Showers am, sunny ints pm |
|
28 |
5.3 |
12.4 |
3.9 |
89 |
99 |
8.7 |
10.0 |
4.3 |
11.2 |
29 |
6.6 |
158 |
2.5 |
1012 |
1021 |
73 |
0.6 |
0.0 |
Drizzle am, cloudy pm |
|
29 |
7.4 |
12.4 |
3.3 |
83 |
98 |
9.2 |
10.0 |
4.2 |
10.8 |
40 |
11.7 |
281 |
11.8 |
999 |
1012 |
115 |
0.5 |
0.8 |
Rain am, sunny intervals pm |
|
30 |
4.3 |
10.9 |
0.7 |
81 |
96 |
9.2 |
10.1 |
3.3 |
9.1 |
22 |
5.2 |
124 |
3.3 |
1005 |
1015 |
288 |
0.7 |
1.3 |
Showers am, sunny ints pm |
|
31 |
9.2 |
11.4 |
5.6 |
87 |
97 |
9.2 |
10.2 |
7.2 |
10.5 |
30 |
9.0 |
219 |
10.0 |
999 |
1014 |
36 |
0.0 |
0.0 |
Rain am, cloudy pm |
|
|
3.8 |
9.8 |
0.5 |
82 |
98 |
8 |
9.9 |
2.1 |
8.0 |
20 |
3.6 |
2699 |
168.3 |
1004 |
1015 |
218 |
0.6 |
83 |
|
Graphs for
December 2012 |
 |
|
Figure 1. Temperature and
Rainfall for December 2012. |
 |
|
Figure 2. Sunshine, UV
Index and solar irradiance for December 2012. |
 |
|
Figure 3.
Wind direction for December 2012. |
 |
|
Figure 4.
Soil & Sea surface
temperature for December 2012. |
 |
|
Figure 5.
Mean wind speed, calm hours and air pressure for December 2012. |
|