|
January 2012 |
|
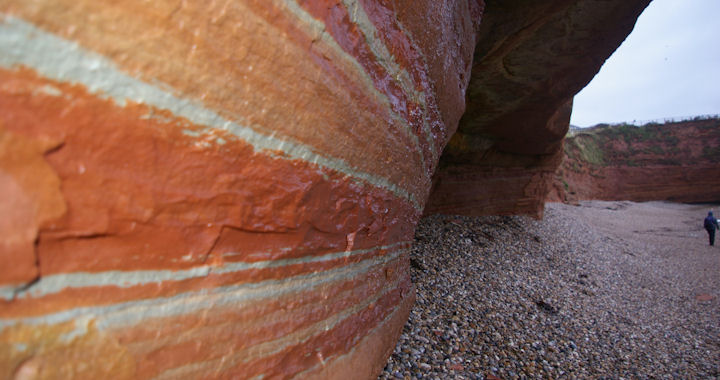
Stripy sandstone rocks at Ladram Bay,
Devon.
Representative of the varying conditions that existed here
during the Triassic period. |
|
Summary for |
January
2012 |
|
Mean Max: |
10.3ºC |
(+1.9ºC) |
|
Mean Min: |
4.4ºC |
(+1.7ºC) |
|
Mean: |
7.4ºC |
(+1.8ºC) |
|
|
|
|
|
High Max: |
13.6ºC |
18th |
|
Low Max: |
3.6ºC |
31st |
|
High Min: |
11.4ºC |
19th |
|
Low Min: |
-1.8ºC |
29th |
|
Mean Grass Min: |
N/A |
|
|
Grass Min: |
N/A |
|
|
|
|
|
|
Rain Total (gauge): |
60.8 mm |
(70%) |
|
Rain Total (tipping bucket): |
60.2 mm |
(69%) |
|
Rain Days >0.2 mm: |
12 Days |
|
|
Rain Days >1.0 mm: |
9 Days |
|
|
Max 24 hrs: |
23.6 mm |
30th |
|
Days without any rain: |
18 |
|
|
|
|
|
|
Air Frost: |
4 Days |
|
|
Ground Frost: |
N/A |
|
|
Snow Falling: |
0 Days |
|
|
Snow (50%) @ 9am: |
0 Days |
|
|
Thunder Heard: |
0 Days |
|
|
Hail <5 mm: |
1 Days |
|
|
Hail >5 mm: |
0 Days |
|
|
Fog @ 9am: |
1 Days |
|
|
|
|
|
|
Total Monthly Sunshine: |
88.0 Hours |
(122%) |
|
Most Sunshine in a Day: |
7.9 Hours |
16th |
|
Average Daily Sunshine: |
2.8 Hours |
|
|
Sunless Days: |
3 Days |
|
|
Cloudless Days: |
3 Days |
|
|
Total Possible Sunshine: |
264.6 Hours |
|
|
Percentage of Total Sun: |
33% |
|
|
Maximum UV Index: |
1.3 |
21st |
|
Time of Max UV |
|
12:45 |
|
|
|
|
|
Mean Soil Temp @ 30 cm: |
N/A |
|
|
Min Soil Temp @ 30 cm: |
|
|
|
Max Soil Temp @ 30 cm: |
|
|
|
Mean Soil Temp @ 100 cm: |
N/A |
|
|
Min Soil Temp @ 100 cm: |
|
|
|
Max Soil Temp @ 100 cm: |
|
|
|
|
|
|
|
Mean 10 Min Wind >39 mph: |
0.01 Days |
|
|
N: |
5.07 Days |
|
|
NE: |
1.28 Days |
|
|
E: |
3.26 Days |
|
|
SE: |
1.16 Days |
|
|
S: |
3.56 Days |
|
|
SW: |
3.76 Days |
|
|
W: |
2.11 Days |
|
|
NW: |
7.53 Days |
|
|
Calm: |
3.27 Days |
|
|
Wind Chill Low: |
-2.9ºC |
29th |
|
Mean Wind: |
3.2 mph |
|
|
Max Gust: |
41 mph |
3rd |
|
|
31.00 Days |
|
|
Mean Cloud Cover: |
67% |
|
|
Mean RH @ 9am: |
91% |
|
|
Rain Duration >0.1mm/hour: |
43.0 Hours |
|
|
Frost Duration: |
26.5 Hours |
|
|
Max Frost Duration in a Day: |
11.3 Hours |
29th |
|
|
|
|
|
Mean Sea Temperature: |
10.0ºC |
(+1.9ºC) |
|
Normal for Month: |
8.1ºC |
|
|
Max Sea Temperature: |
10.7ºC |
3rd |
|
Min Sea Temperature: |
8.8ºC |
31st |
|
|
|
|
|
Mean Pressure @ 9am: |
1022.1 hPa |
(+6.8 hPa) |
|
Mean Pressure: |
1022.1 hPa |
(+6.8 hPa) |
|
Max Pressure: |
1035.9 hPa |
11th |
|
Min Pressure: |
997.8 hPa |
3rd |
|
|
|
|
|
Radiation Daily Mean |
2.4 W/m² |
|
|
Max Daily Value |
12.5 MJ/m² |
21st |
|
Min Daily Value |
2.0 MJ/m² |
25th |
|
Number of Days with Data |
31 Days |
|
|
1-Hour Maximum |
663 W/m² |
21st |
|
Starting Time of the Hour |
|
12:45 |
|
|
|
|
|
Max Dewpoint: |
12.3ºC |
18th |
|
Min Dewpoint: |
-2.9ºC |
29th |
|
Mean Dewpoint: |
4.8ºC |
|
|
|
|
|
|
Max Humidity: |
98% |
10th |
|
Min Humidity: |
59% |
26th |
|
Mean Humidity: |
85% |
(-1) |
|
|
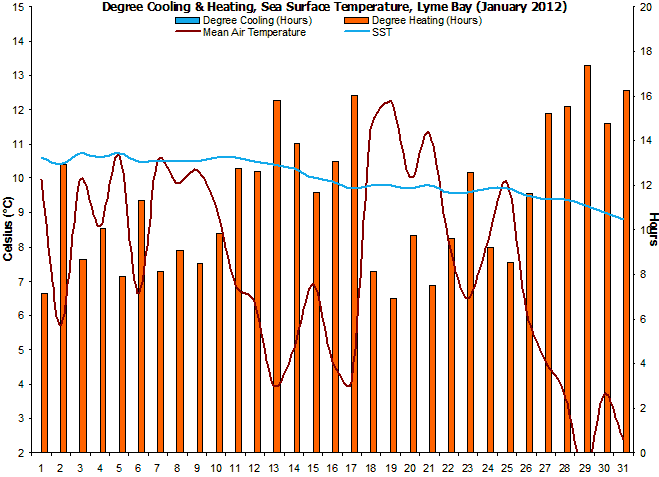
A warm and generally settled month.
As with
November and December, this was a warmer than average month though
this time, the weather was generally more settled.
Especially during the 2nd and 3rd weeks, where little
rain fell. |
|
Rainfall was concentrated
at the beginning and end of the month, and from the 6th
to the 24th, only 1.2 mm fell. The wettest days were the
29th & 30th and this accounted for the majority of the
rain that fell during the entire month. |
|
There
were 4 air frosts and none of these were severe. No snow
was seen falling or lying, a different story to
January 2010.
No ground frost readings taken this month due to
relocation of sensor. |
|
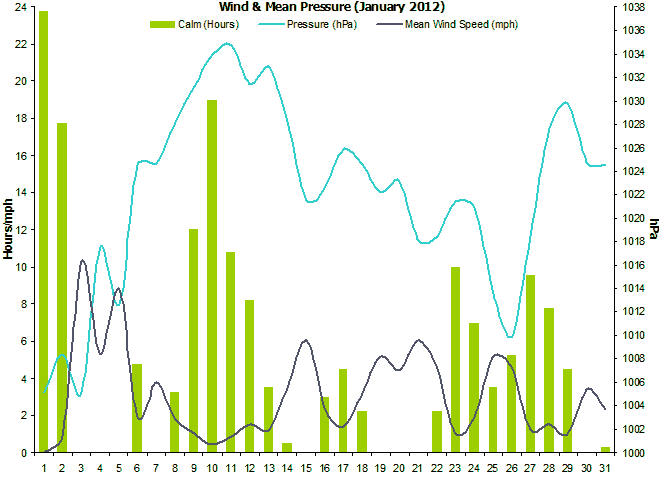
Sunshine
levels were a little above the long term average for
January. A particularly sunny, clear day on the 16th
with 7.9 hours, this was 93% of the total possible. As
expected for January, UV levels remained low. |
|
No soil temperature
readings were taken due to relocation of sensors. |
|
Interestingly, for a month
that was so warm the dominant wind direction was
north-westerly. This was due to mild, Atlantic air
moving around the top of an anticyclonic 'high' pressure
system generally located just to the south-west. Apart
from the beginning of the month, winds were generally
light. |
|
Rainfall mainly occurred
at the beginning and end of the month. |
|
Sea surface temperatures
were above normal at the beginning of the month
and generally stayed that way. |
|
Mean pressure was rather
above the average for January and indicative of the settled nature
of this month. |
|
A new sensor has been
added that measures solar irradiance in watts per square
metre falling on a horizontal surface. |
|
Dewpoints were often well above
the average. |
|
Despite the higher than
average dewpoints, the relative humidity was below
normal, probably due to the warmth that dominated
through the month. |
|
|
|
Weather Data for Otter Valley, Devon. |
January 2012 |
|
|
|
Temp (oC) |
Hum (RH%) |
Dewpoint (oC) |
Wind (mph) |
Rain |
Pressure (hPa) |
Grass |
Sun |
|
|
|
Min |
Max |
Ave |
Min |
Max |
Ave |
Min |
Max |
Ave |
Max |
Ave |
Run |
mm |
Min |
Max |
Ave |
Min |
Hours |
Observations |
|
1 |
7.5 |
12.4 |
10.0 |
87 |
94 |
91 |
5.7 |
11.2 |
8.5 |
0 |
0.0 |
0 |
3.4 |
1001 |
1010 |
1005 |
|
0.0 |
Cloudy am, rain pm |
|
2 |
2.4 |
9.0 |
5.7 |
74 |
95 |
85 |
0.4 |
5.5 |
3.0 |
18 |
0.9 |
21 |
2.4 |
1004 |
1013 |
1008 |
|
3.8 |
Sun & showers all day |
|
3 |
6.9 |
12.9 |
9.9 |
74 |
93 |
84 |
2.8 |
11.5 |
7.2 |
41 |
10.3 |
247 |
10.8 |
998 |
1013 |
1005 |
|
0.8 |
Rain am, then sunny ints |
|
4 |
6.7 |
10.5 |
8.6 |
68 |
85 |
77 |
1.8 |
7.0 |
4.4 |
29 |
5.3 |
127 |
0.0 |
1011 |
1024 |
1018 |
|
0.6 |
Sunny ints am, cloudy pm |
|
5 |
9.8 |
11.5 |
10.7 |
65 |
92 |
79 |
4.4 |
9.9 |
7.2 |
35 |
8.8 |
211 |
3.2 |
1006 |
1020 |
1013 |
|
5.3 |
Sunny intervals all day |
|
6 |
2.7 |
10.6 |
6.7 |
75 |
97 |
86 |
1.0 |
8.9 |
5.0 |
18 |
2.0 |
47 |
0.0 |
1020 |
1029 |
1024 |
|
2.2 |
Sunny am, cloudy pm |
|
7 |
9.7 |
11.3 |
10.5 |
70 |
93 |
82 |
4.6 |
9.7 |
7.2 |
18 |
3.8 |
91 |
0.0 |
1022 |
1027 |
1025 |
|
4.5 |
Sunny intervals all day |
|
8 |
7.2 |
12.5 |
9.9 |
72 |
95 |
84 |
4.0 |
10.1 |
7.1 |
13 |
1.8 |
44 |
0.0 |
1027 |
1030 |
1028 |
|
1.8 |
Sunny intervals all day |
|
9 |
8.1 |
12.4 |
10.3 |
77 |
96 |
87 |
7.1 |
9.4 |
8.3 |
12 |
1.0 |
25 |
0.0 |
1029 |
1033 |
1031 |
|
0.7 |
Brief sunny intervals all day |
|
10 |
6.2 |
12.1 |
9.2 |
82 |
98 |
90 |
5.2 |
9.5 |
7.4 |
11 |
0.5 |
12 |
0.0 |
1033 |
1035 |
1034 |
|
0.8 |
Cloudy am, sunny ints pm |
|
11 |
1.1 |
12.7 |
6.9 |
76 |
98 |
87 |
0.1 |
9.6 |
4.9 |
10 |
0.9 |
21 |
0.0 |
1034 |
1036 |
1035 |
|
7.6 |
Sunny all day |
|
12 |
0.3 |
12.5 |
6.4 |
85 |
98 |
92 |
-1.0 |
10.3 |
4.7 |
15 |
1.5 |
37 |
0.0 |
1029 |
1034 |
1031 |
|
0.4 |
Sunny ints am, cloudy pm |
|
13 |
-0.9 |
8.8 |
4.0 |
77 |
98 |
88 |
-1.5 |
6.8 |
2.7 |
7 |
1.2 |
30 |
0.0 |
1031 |
1034 |
1033 |
|
6.7 |
Fog early am, then sunny |
|
14 |
2.1 |
8.0 |
5.1 |
67 |
97 |
82 |
-1.7 |
4.7 |
1.5 |
20 |
3.5 |
84 |
0.0 |
1024 |
1032 |
1028 |
|
2.5 |
Early cloud, then sunny ints |
|
15 |
6.2 |
7.6 |
6.9 |
67 |
74 |
71 |
1.0 |
2.6 |
1.8 |
24 |
6.1 |
145 |
0.0 |
1019 |
1024 |
1022 |
|
3.8 |
Sunny intervals all day |
|
16 |
0.7 |
8.6 |
4.7 |
70 |
92 |
81 |
-1.0 |
4.4 |
1.7 |
22 |
2.4 |
58 |
0.0 |
1020 |
1025 |
1023 |
|
7.9 |
Sunny all day |
|
17 |
-1.1 |
9.2 |
4.1 |
80 |
96 |
88 |
-2.3 |
6.3 |
2.0 |
7 |
1.3 |
32 |
0.0 |
1025 |
1027 |
1026 |
|
4.9 |
Cloudy am, sunny pm |
|
18 |
9.2 |
13.6 |
11.4 |
88 |
98 |
93 |
1.8 |
12.3 |
7.1 |
16 |
3.2 |
77 |
0.6 |
1023 |
1026 |
1025 |
|
0.7 |
Brief sunny intervals all day |
|
19 |
11.4 |
13.1 |
12.3 |
77 |
95 |
86 |
5.3 |
11.0 |
8.2 |
22 |
5.2 |
125 |
0.0 |
1020 |
1025 |
1022 |
|
1.1 |
Cloudy am, sunny ints pm |
|
20 |
7.7 |
12.3 |
10.0 |
73 |
94 |
84 |
3.5 |
9.5 |
6.5 |
19 |
4.5 |
116 |
0.0 |
1021 |
1025 |
1023 |
|
3.4 |
Cloudy am, sunny pm |
|
21 |
9.4 |
13.2 |
11.3 |
74 |
95 |
85 |
4.8 |
10.2 |
7.5 |
25 |
6.1 |
146 |
0.2 |
1015 |
1021 |
1018 |
|
2.2 |
Sunny ints and showers |
|
22 |
4.4 |
12.0 |
8.2 |
67 |
90 |
79 |
1.0 |
7.5 |
4.3 |
25 |
4.6 |
109 |
0.0 |
1016 |
1021 |
1018 |
|
3.8 |
Sunny intervals all day |
|
23 |
2.6 |
10.4 |
6.5 |
82 |
98 |
90 |
0.9 |
7.9 |
4.4 |
12 |
1.0 |
25 |
0.4 |
1020 |
1023 |
1021 |
|
2.2 |
Sunny intervals all day |
|
24 |
4.6 |
11.8 |
8.2 |
92 |
98 |
95 |
3.2 |
10.7 |
7.0 |
16 |
1.9 |
42 |
3.4 |
1019 |
1023 |
1021 |
|
0.2 |
Rain am, showers pm |
|
25 |
8.7 |
11.0 |
9.9 |
89 |
96 |
93 |
7.3 |
9.7 |
8.5 |
29 |
5.1 |
121 |
2.2 |
1008 |
1020 |
1014 |
|
0.0 |
Light rain, intermittent all day |
|
26 |
2.1 |
10.2 |
6.2 |
59 |
97 |
78 |
0.3 |
9.3 |
4.8 |
25 |
4.6 |
110 |
4.6 |
1006 |
1014 |
1010 |
|
6.7 |
Rain early am, then sunny |
|
27 |
0.3 |
9.1 |
4.7 |
70 |
98 |
84 |
-0.7 |
6.1 |
2.7 |
15 |
1.2 |
30 |
1.0 |
1014 |
1023 |
1018 |
|
5.4 |
Sunny am, showers pm |
|
28 |
-0.6 |
8.0 |
3.7 |
67 |
98 |
83 |
-1.8 |
3.4 |
0.8 |
11 |
1.5 |
36 |
0.0 |
1022 |
1033 |
1028 |
|
6.0 |
Sunny intervals all day |
|
29 |
-1.8 |
4.6 |
1.4 |
91 |
97 |
94 |
-2.9 |
3.4 |
0.3 |
7 |
1.0 |
24 |
5.0 |
1027 |
1033 |
1030 |
|
0.3 |
Sunny ints am, cloudy pm |
|
30 |
2.3 |
5.1 |
3.7 |
90 |
96 |
93 |
1.1 |
4.2 |
2.7 |
13 |
3.4 |
82 |
23.6 |
1023 |
1027 |
1025 |
|
0.0 |
Rain all day |
|
31 |
1.2 |
3.6 |
2.4 |
76 |
90 |
83 |
-2.2 |
1.1 |
-0.6 |
13 |
2.3 |
56 |
0.0 |
1022 |
1027 |
1025 |
|
1.4 |
Sunny ints am, cloudy pm |
|
|
4.4 |
10.3 |
7.4 |
76 |
95 |
85 |
1.7 |
7.9 |
4.8 |
18 |
3.2 |
2328 |
60.8 |
1019 |
1025 |
1022 |
|
88.0 |
|
Graphs for
January 2012 |
 |
|
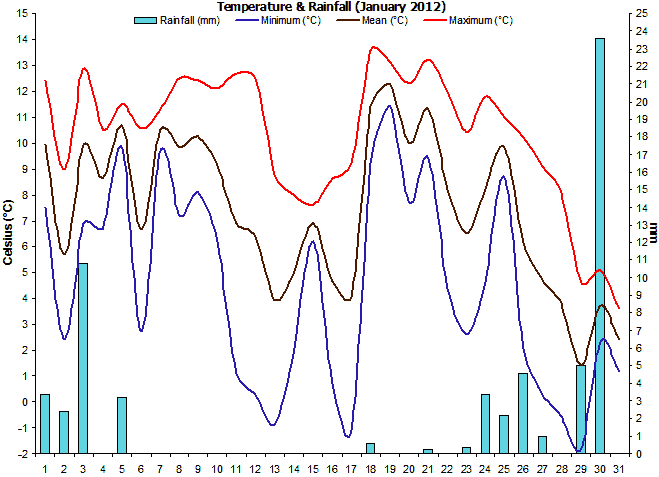
Figure 1. Temperature and
Rainfall for January 2012. |
 |
|
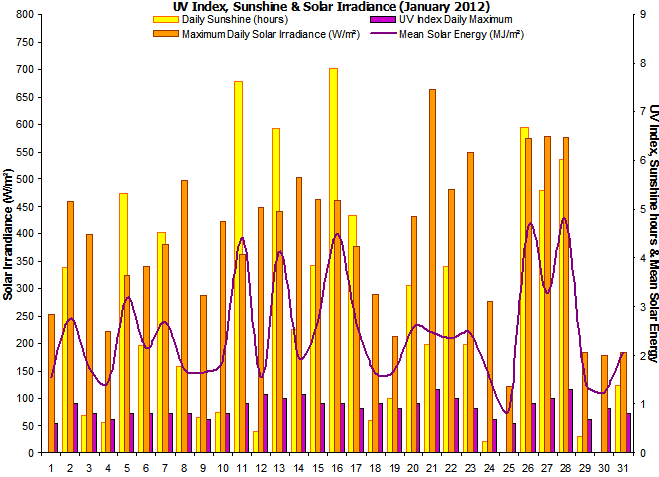
Figure 2. Sunshine, air
pressure and mean wind speed for January 2012. |
 |
|
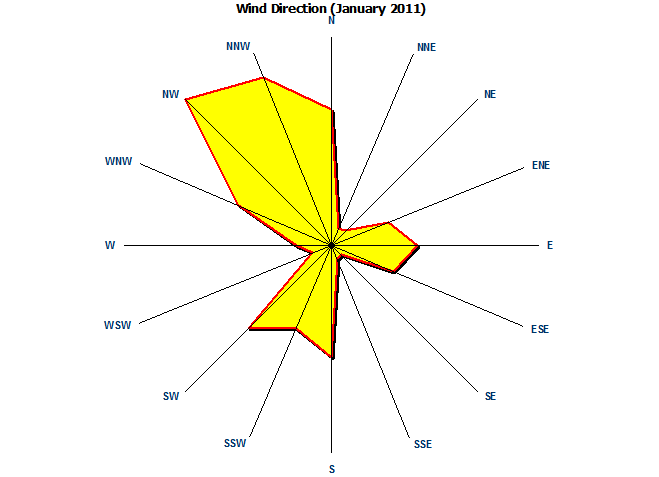
Figure 3.
Wind direction for January 2012. |
 |
|
Figure 4. Soil & sea
surface temperature (SST) for Lyme Bay for January 2012. |
 |
|
Figure 5.
Wind run,
maximum gusts and mean pressure for January 2012. |
|