February 2013

Late afternoon winter sunshine in an Otter Valley wood.
Late afternoon February sunshine in an Otter Valley woodland.

 
Summary for  February 2013
Mean Max: 8.0ºC (-0.8ºC)
Mean Min: 2.2ºC (-0.5ºC)
Mean: 5.1ºC (-0.7ºC)
     
High Max: 13.5ºC 15th
Low Max: 3.1ºC 22nd 
High Min: 7.8ºC 4th
Low Min: -1.9ºC 28th
Mean Grass Min: -0.4ºC  
Grass Min: -4.3ºC 7th
     
Rain Total (gauge): 49.3 mm (80%)
Rain Total (tipping bucket): 49.3 mm (80%)
Rain Days >0.2 mm: 10 Days  
Rain Days >1.0 mm: 7 Days  
Max 24 hrs: 15.0 mm 10th
Days without any rain: 18  
     
Air Frost: 8 Days  
Grass Frost: 16 Days  
Snow Falling: 0 Days  
Snow (50%) @ 9am: 0 Days  
Ice Days: 0 Days  
Thunder Heard: 0 Days  
Hail <5 mm: 1 Day  
Hail >5 mm: 0 Days  
Fog @ 9am: 2 Days  
     
Total Monthly Sunshine: 78.2 Hours (96%)
Most Sunshine in a Day: 8.9 Hours 17th
Average Daily Sunshine: 2.8 Hours  
Sunless Days: 7 Days  
Cloudless Days: 1 Day  
Total Possible Sunshine: 281.9 Hours  
Percentage of Total Sun: 28%  
Maximum UV Index: 1.8 16th
Time of Max UV:   11:45
     
Mean Soil Temp @ 30 cm: 6.9ºC  
Min Soil Temp @ 30 cm: 5.6ºC 24th
Max Soil Temp @ 30 cm: 8.2ºC 1st
Mean Soil Temp @ 100 cm: 8.8ºC  
Min Soil Temp @ 100 cm: 8.2ºC 28th
Max Soil Temp @ 100 cm: 9.2ºC 3rd 
     
Mean 10 Min Wind >39 mph: 0.00 Days  
N: 10.01 Days  
NE: 1.89 Days  
E: 4.20 Days  
SE: 1.88 Days  
S: 0.97 Days  
SW: 0.93 Days  
W: 1.17 Days  
NW: 5.15 Days  
Calm: 1.81 Days  
Wind Chill Low: -2.7ºC 28th
Mean Wind: 3.2 mph  
Max Gust: 29 mph 5th
  28.00 Days  
Mean Cloud Cover: 67%  
Mean RH @ 9am: 89%  
Rain Duration >0.1mm/hour: 35.3 Hours  
Frost Duration: 31.5 Hours  
Max Frost Duration in a Day: 7.3 Hours 3rd 
     
Mean Sea Temperature: 8.1ºC (0.0ºC)
Normal for Month: 8.1ºC  
Max Sea Temperature: 8.7ºC 1st
Min Sea Temperature: 7.1ºC 28th
     
Mean Pressure @ 9am: 1018.7 hPa (+4.1 hPa)
Mean Pressure: 1018.4 hPa (+3.8 hPa)
Max Pressure: 1035.5 hPa 27th
Min Pressure: 989.6 hPa 10th
Max Change in 24 hours: 24.8 hPa 2nd 
   
Radiation Daily Mean: 5.25 MJ/m²  
Max Daily Value: 11.46 MJ/m² 17th
Min Daily Value: 1.05 MJ/m² 13th
Number of Days with Data: 28 Days  
1-Hour Maximum: 624 W/m² 16th
Starting Time of the Hour:   11:00
     
Max Dewpoint: 9.5ºC 14th
Min Dewpoint: -5.3ºC 22nd 
Mean Dewpoint: 2.3ºC  
     
Max Humidity: 99% 10th
Min Humidity: 53% 6th
Mean Humidity: 83%  

Unsettled and mild until mid-month, then dry and progressively colder.

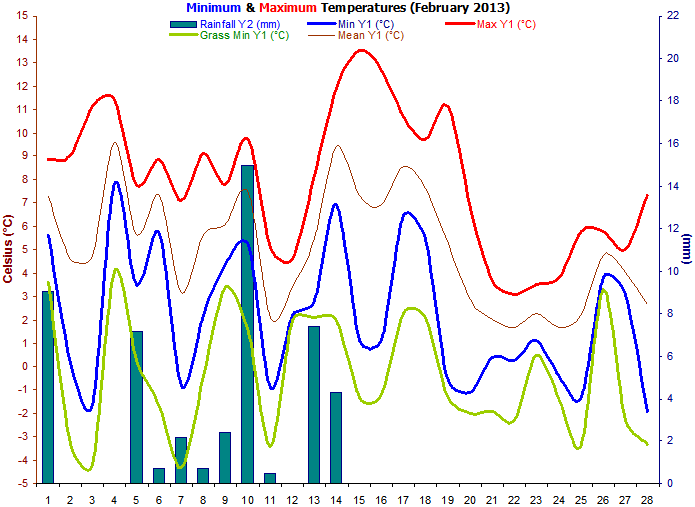
Temperatures were predominantly in the mild to very mild category up until the 19th. Then it gradually turned colder though there were no really cold days and overall the month ended up just a little colder than normal. There was a run of very mild days from the 14th to the 19th with 13.5°C being reached on the 15th.

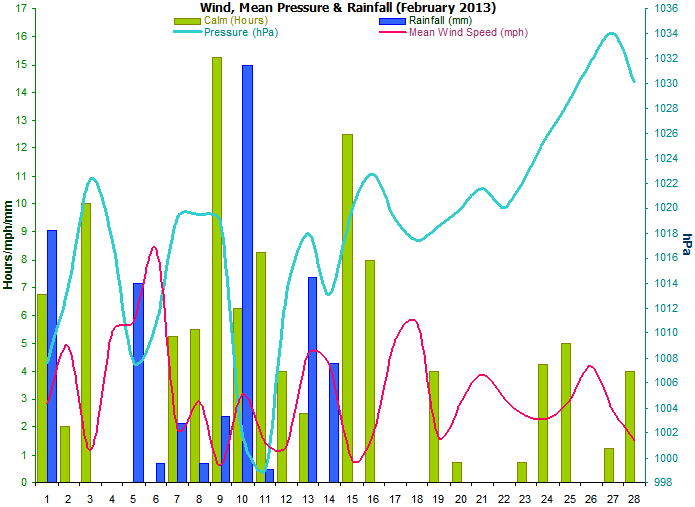
The first drier than normal month since June 2012. After a wet start, no rain fell from the 15th until the end of the month. The wettest day of the entire month was the 10th and that received 15.0 mm. There were only 7 wet days.
A moderately high amount of air frosts though none were severe with -1.9°C being the harshest. No snow was seen falling or lying at any point in the month. There were a high amount of grass frosts due to a prevalence of calm, starry nights especially from the 15th onwards.
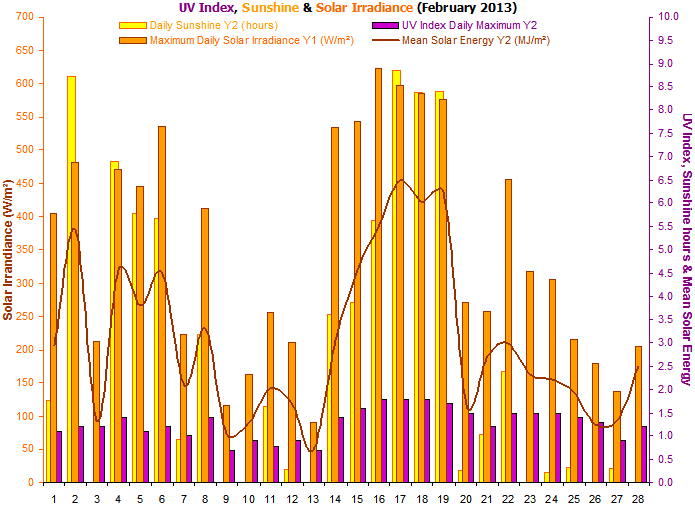
Sunshine amounts were just below the average. There was a very sunny spell that lasted from the 14th to the 19th and helped push the sunshine hours up after quite a cloudy few days from the 9th to the 13th. The last 8 days of the month were very cloudy and cool.
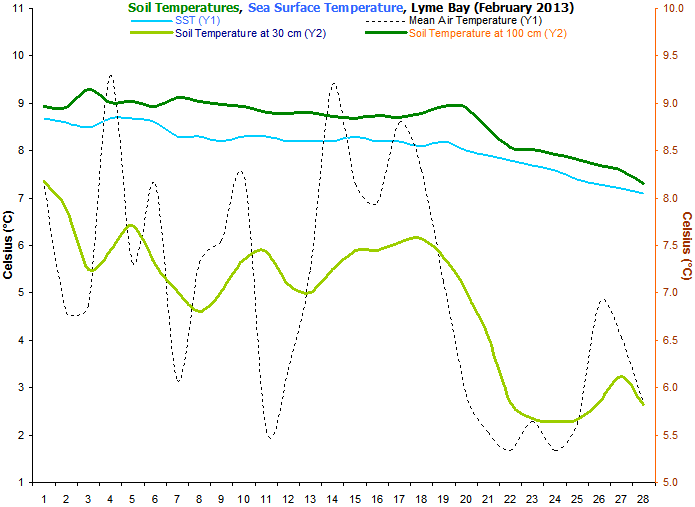
Soil temperatures only slowly declined from the beginning of the month until the 18th, then they fell fairly rapidly during a run of colder days and nights. There was a slight recovery in the 30 cm soil temperature at the end of the month, though the 100 cm soil temperature continued to fall.
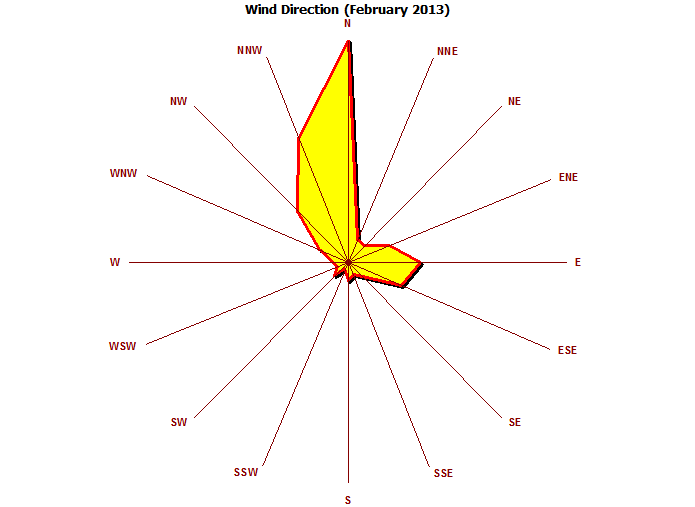
Overall this was a quiet month wind-wise, especially after mid-month. There were no high wind speeds and the maximum gust was only 29 mph on the 5th. This is actually quite low for a maximum February gust. Winds were dominant from the northerly, and north-westerly directions with a brief easterly spell during the 3rd week.
The rainfall duration was only 35 hours and reflects the lower than normal amount of rainfall that actually fell during this month.
Sea surface temperatures fell only slowly right through the entire month reaching a low of 7.1°C on the 28th. Overall SSTs were average.
Mean pressure was a rather above the average for February and indicative of the settled conditions that dominated the second half of this month 
A new sensor has been added that measures solar irradiance in watts per square metre falling on a horizontal surface.
Dewpoints were below the average.
Relative humidity was a little below normal.
   
Weather Data for Otter Valley, Devon.  February 2013  
  Temp oC Grass Hum (%) Soil oC DP (oC) Wind (mph) Rain Air (hPa) W/m² UV Sun  
  Min Max Min Min Max 30 100 Min Max Max Ave Run mm Min Max Max Max Hours Observations
1 5.6 8.9 3.6 76 97 8.2 9.0 3.9 6.6 19 2.9 68 9.0 1000 1015 406 1.1 1.8 Sunny intervals all day
2 0.2 9.0 -3.3 58 92 7.9 9.0 -0.9 3.9 21 4.9 117 0.0 1001 1026 482 1.2 8.7 Sunny all day
3 -1.6 11.1 -4.2 89 97 7.3 9.2 -2.6 9.3 13 1.2 29 0.0 1018 1027 212 1.2 0.0 Cloudy all day
4 7.8 11.4 4.1 58 93 7.4 9.0 3.3 9.3 24 5.4 130 0.0 1015 1020 472 1.4 6.9 Sunny intervals all day
5 3.5 7.8 0.3 69 91 7.7 9.0 0.4 5.0 29 5.8 138 7.1 1000 1015 445 1.1 5.8 Sunshine & showers all day
6 5.7 8.9 -1.7 53 88 7.3 9.0 -1.7 4.8 29 8.4 201 0.7 1001 1021 536 1.2 5.7 Sunny intervals all day
7 -0.8 7.1 -4.3 73 96 7.0 9.1 -2.3 3.7 13 1.9 47 2.1 1015 1023 223 1.0 0.9 Sunny ints am, cloudy pm
8 2.2 9.1 -0.4 73 98 6.8 9.0 1.3 4.6 16 2.9 71 0.7 1015 1024 413 1.4 3.2 Sunny intervals all day
9 4.4 7.8 3.4 84 98 7.0 9.0 3.3 6.9 10 0.6 15 2.4 1014 1024 117 0.7 0.0 Patchy light rain all day
10 5.2 9.7 1.5 90 99 7.4 9.0 4.0 9.4 18 3.2 76 15.0 990 1014 162 0.9 0.0 Rain, intermittent all day
11 -0.9 5.1 -3.4 89 99 7.4 8.9 -1.7 4.9 12 1.4 34 0.5 991 1007 257 0.8 1.6 Sunny ints am, cloudy pm
12 2.2 4.6 2.0 81 92 7.1 8.9 0.7 2.0 9 1.3 31 0.0 1007 1019 210 0.9 0.3 Sunny ints am, cloudy pm
13 2.8 8.2 2.1 84 98 7.0 8.9 0.2 7.7 24 4.6 111 7.4 1016 1021 91 0.7 0.0 Rain, intermittent all day
14 6.9 11.9 2.0 71 99 7.3 8.9 5.5 9.5 21 4.2 102 4.3 1009 1017 534 1.4 3.6 Sunny intervals all day
15 1.1 13.5 -1.3 61 99 7.4 8.8 0.2 8.0 8 0.8 19 0.0 1017 1023 543 1.6 3.9 Sunny intervals all day
16 1.1 12.7 -1.2 71 99 7.4 8.9 0.2 8.3 15 1.8 42 0.0 1022 1024 624 1.8 5.6 Sunny intervals all day
17 6.5 10.7 2.3 64 94 7.5 8.9 3.6 6.2 22 5.1 123 0.0 1016 1022 597 1.8 8.9 Sunny intervals all day
18 5.5 9.7 2.1 74 91 7.6 8.9 3.5 5.7 23 5.7 137 0.0 1016 1019 585 1.8 8.4 Sunny intervals all day
19 -0.6 11.1 -1.3 70 99 7.4 9.0 -1.3 6.2 14 1.7 40 0.0 1017 1020 576 1.7 8.4 Sunny intervals all day
20 -1.1 6.8 -2.0 79 98 7.0 9.0 -1.7 4.5 19 2.9 76 0.0 1018 1022 271 1.5 0.3 Brief sunny intervals all day
21 0.4 3.7 -1.9 66 84 6.5 8.7 -4.9 -0.4 22 3.9 93 0.0 1020 1023 258 1.2 1.0 Brief sunny intervals all day
22 0.3 3.1 -2.3 62 71 5.9 8.5 -5.3 -3.0 17 3.1 73 0.0 1019 1021 456 1.5 2.4 Brief sunny intervals all day
23 1.1 3.5 0.5 69 83 5.7 8.5 -4.1 -1.3 13 2.4 58 0.0 1021 1024 318 1.5 0.0 Cloudy all day
24 -0.4 3.8 -1.4 65 93 5.6 8.5 -2.7 -0.3 14 2.3 51 0.0 1024 1027 305 1.5 0.2 Brief sunny intervals all day
25 -1.3 5.8 -3.3 69 90 5.7 8.4 -3.2 2.6 16 3.0 72 0.0 1027 1030 215 1.4 0.3 Brief sunny intervals all day
26 3.8 5.8 3.3 83 91 5.8 8.4 1.6 3.6 26 4.2 100 0.0 1029 1035 179 1.3 0.0 Cloudy all day
27 3.1 5.0 -2.3 86 91 6.1 8.3 -1.2 3.3 15 2.6 61 0.0 1033 1036 137 0.9 0.3 Brief sunny intervals all day
28 -1.9 7.3 -3.3 59 97 5.8 8.2 -3.0 1.1 15 1.5 34 0.0 1028 1033 204 1.2 0.0 Cloudy all day
2.2 8.0 -0.4 72 93 7 8.8 -0.2 4.7 18 3.2 2148 49.3 1014 1023 351 1.3 78  

Graphs for February 2013

Figure 1. Temperature and Rainfall for February 2013.
Figure 2. Sunshine, UV Index and solar irradiance for February 2013.
Figure 3. Wind direction for February 2013.
Figure 4. Soil & Sea surface temperature for February 2013.
Figure 5. Mean wind speed, calm hours and air pressure for February 2013.