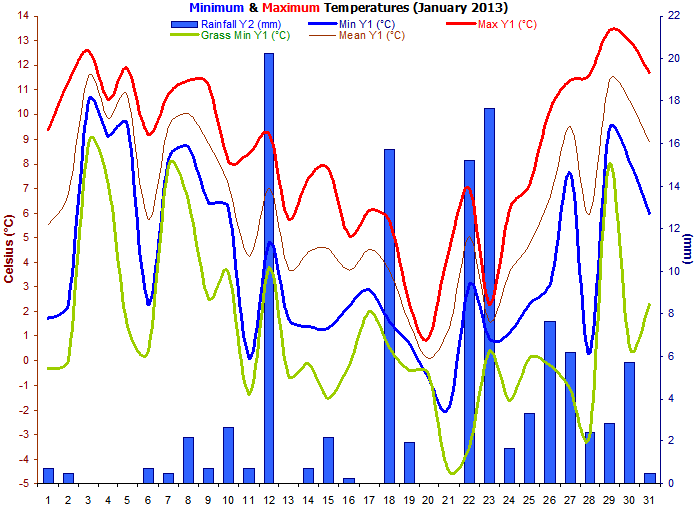
January 2013

Winter brightness out over the sea near Salcombe Regis on a January afternoon.

 
Summary for  January 2013
Mean Max: 8.5ºC (-0.4ºC)
Mean Min: 3.9ºC (+0.8ºC)
Mean: 6.2ºC (+0.2ºC)
     
High Max: 13.4ºC 29th
Low Max: 0.9ºC 20th
High Min: 10.5ºC 3rd 
Low Min: -1.9ºC 21st
Mean Grass Min: 1.2ºC  
Grass Min: -4.5ºC 21st
     
Rain Total (gauge): 112.9 mm (138%)
Rain Total (tipping bucket): 112.1 mm (137%)
Rain Days >0.2 mm: 24 Days  
Rain Days >1.0 mm: 15 Days  
Max 24 hrs: 20.2 mm 12th
Days without any rain: 7  
     
Air Frost: 2 Days  
Grass Frost: 14 Days  
Snow Falling: 1 Day  
Snow (50%) @ 9am: 0 Days  
Ice Days: 0 Days  
Thunder Heard: 0 Days  
Hail <5 mm: 3 Days  
Hail >5 mm: 0 Days  
Fog @ 9am: 0 Days  
     
Total Monthly Sunshine: 67.2 Hours (101%)
Most Sunshine in a Day: 8.1 Hours 24th
Average Daily Sunshine: 2.2 Hours  
Sunless Days: 15 Days  
Cloudless Days: 2 Days  
Total Possible Sunshine: 265.5 Hours  
Percentage of Total Sun: 25%  
Maximum UV Index: 1.1 27th
Time of Max UV:   12:30
     
Mean Soil Temp @ 30 cm: 7.8ºC  
Min Soil Temp @ 30 cm: 5.6ºC 25th
Max Soil Temp @ 30 cm: 9.8ºC 9th
Mean Soil Temp @ 100 cm: 9.7ºC  
Min Soil Temp @ 100 cm: 8.4ºC 27th
Max Soil Temp @ 100 cm: 10.6ºC 12th
     
Mean 10 Min Wind >39 mph: 0.00 Days  
N: 5.99 Days  
NE: 1.73 Days  
E: 2.96 Days  
SE: 2.38 Days  
S: 6.24 Days  
SW: 3.31 Days  
W: 0.81 Days  
NW: 3.30 Days  
Calm: 4.29 Days  
Wind Chill Low: -2.8ºC 18th
Mean Wind: 3.4 mph  
Max Gust: 35 mph 28th
  31.00 Days  
Mean Cloud Cover: 73%  
Mean RH @ 9am: 92%  
Rain Duration >0.1mm/hour: 74.0 Hours  
Frost Duration: 25.8 Hours  
Max Frost Duration in a Day: 14.3 Hours 21st
     
Mean Sea Temperature: 9.6ºC (+1.2ºC)
Normal for Month: 8.4ºC  
Max Sea Temperature: 10.7ºC 1st
Min Sea Temperature: 8.0ºC 28th
     
Mean Pressure @ 9am: 1014.1 hPa (-0.5 hPa)
Mean Pressure: 1013.3 hPa (-1.3 hPa)
Max Pressure: 1039.7 hPa 4th
Min Pressure: 992.1 hPa 21st
Max Change in 24 hours: 19.3 hPa 25th
   
Radiation Daily Mean: 2.8 MJ/m²  
Max Daily Value: 7.7 MJ/m² 30th
Min Daily Value: 0.8 MJ/m² 18th
Number of Days with Data: 31 Days  
1-Hour Maximum: 491 W/m² 30th
Starting Time of the Hour:   12:00
     
Max Dewpoint: 12.4ºC 29th
Min Dewpoint: -3.2ºC 20th
Mean Dewpoint: 4.5ºC  
     
Max Humidity: 100% 6th
Min Humidity: 59% 17th
Mean Humidity: 89%  

Mild and relatively dry for the first two weeks then much colder and wetter. The warmth and sunnier weather arrived for the last week.

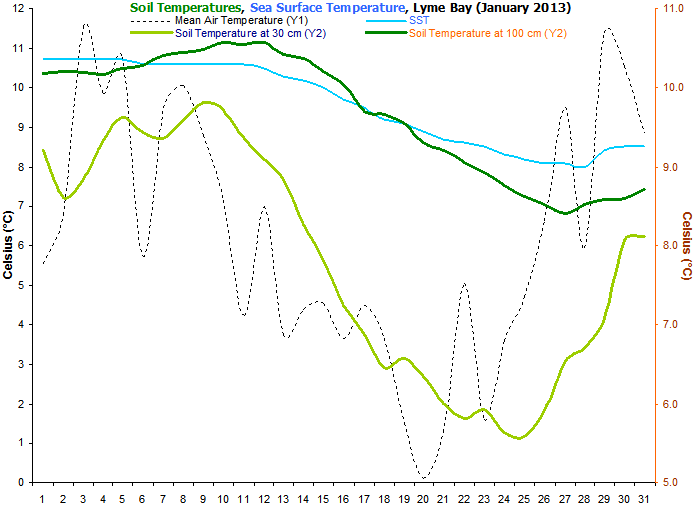
Temperatures were consistently in the mild to very mild category up until the 13th, then it turned colder but there were no really cold days except the 20th with a maximum of just 0.9°C. The warmth returned with 13.4°C on both the 29th & 30th.

Another wet month, keeping the trend of wetter than average months going that started in June 2012. The Otter Valley did not receive as much rainfall as other parts of Devon & Cornwall, probably due to the rainfall shadow effect of Dartmoor in a SW airstream.
January often sees a few air frosts though this year there were only two and both of these were not particularly severe. Despite only two air frosts, there were plenty of grass frosts and snow was seen falling on one day but it did not settle on the ground.
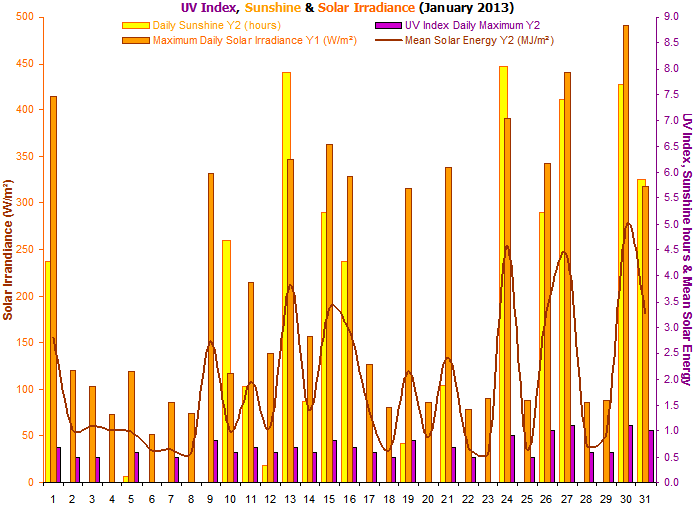
Sunshine amounts were well below average until the final week of the month. This was mainly due to a very dull period of weather that lasted from the 1st to the 9th. The month also had 15 sunless days which is the highest number recorded (by a long way) in any month. A sunnier end to the month allowed sunshine levels to recover.
Soil temperatures rose slowly at first but then declined rapidly with the colder conditions of the late 2nd and 3rd weeks. A small recovery occurred during the final week of the month as very mild weather prevailed.
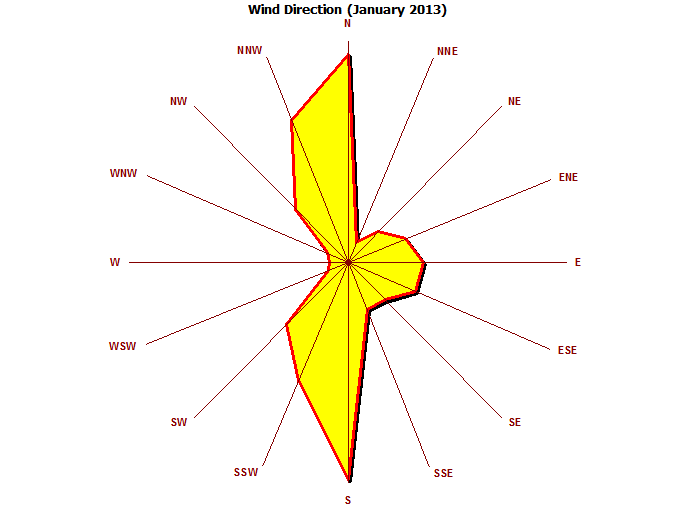
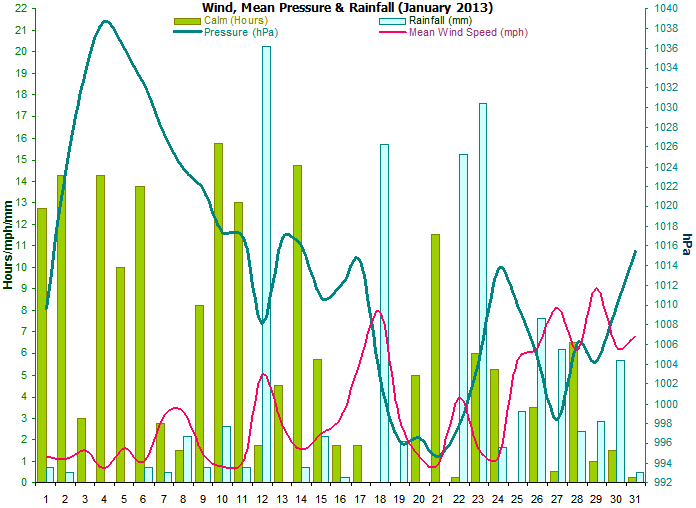
Overall this was quite a breezy month but that is not unusual for January. There were no high wind speeds though on the 28th, gusts did reach 35 mph (60 kph). This is actually quite low for a maximum January gust. Winds were dominant from the north, south and south-westerly directions.
The rainfall duration of 74 hours and reflects the high amount of rainfall that actually fell during this month.
Sea surface temperatures fell sharply during the colder nights and days of the late 2nd and 3rd weeks, but then rose again with the warmer conditions from the 28th onwards.
Mean pressure was a little below the average for December and indicative of the unsettled conditions that dominated this month.
A new sensor has been added that measures solar irradiance in watts per square metre falling on a horizontal surface.
Dewpoints were above the average.
Relative humidity was a little above normal.
   
Weather Data for Otter Valley, Devon.  January 2013  
  Temp oC Grass Hum (%) Soil oC DP (oC) Wind (mph) Rain Air (hPa) W/m² UV Sun  
  Min Max Min Min Max 30 100 Min Max Max Ave Run mm Min Max Max Max Hours Observations
1 1.7 9.4 -0.3 77 99 9.2 10.2 1.1 8.2 17 1.2 30 0.7 1001 1019 414 0.7 4.3 Sunny intervals all day
2 2.3 11.3 0.0 94 99 8.6 10.2 1.6 10.6 16 1.1 26 0.5 1019 1028 121 0.5 0.0 Cloudy all day
3 10.5 12.6 8.8 88 96 8.8 10.2 9.0 10.8 12 1.5 36 0.0 1028 1039 103 0.5 0.0 Drizzle am, cloudy pm
4 9.1 10.6 7.1 86 96 9.3 10.2 7.4 9.3 11 0.7 17 0.0 1038 1040 74 0.0 0.0 Cloudy all day
5 9.6 11.9 1.4 89 97 9.6 10.2 3.6 10.6 12 1.6 38 0.0 1034 1038 120 0.6 0.1 Cloudy all day
6 2.3 9.2 0.4 96 100 9.4 10.3 1.8 9.0 9 1.0 24 0.7 1030 1035 51 0.0 0.0 Brief sunny intervals
7 8.2 10.8 7.9 90 99 9.4 10.4 7.8 10.0 13 3.1 75 0.5 1025 1030 87 0.5 0.0 Cloudy all day
8 8.7 11.4 6.5 91 99 9.6 10.4 7.9 11.0 14 3.3 80 2.1 1023 1025 75 0.0 0.0 Cloudy all day
9 6.4 11.2 2.5 82 99 9.8 10.5 5.1 10.6 10 1.3 32 0.7 1020 1023 332 0.8 0.0 Cloudy all day
10 6.2 8.1 3.6 92 98 9.7 10.6 5.5 7.6 15 0.8 19 2.6 1014 1020 117 0.6 4.7 Sunny intervals all day
11 0.1 8.4 -1.4 89 99 9.4 10.5 -0.4 8.1 12 0.9 23 0.7 1013 1021 215 0.7 1.9 Sunny ints am, cloudy pm
12 4.8 9.2 3.8 88 99 9.1 10.6 4.1 8.0 28 5.0 120 20.2 1003 1014 139 0.6 0.3 Sunshine & showers all day
13 1.7 5.8 -0.6 69 95 8.8 10.4 -0.1 4.0 14 2.7 64 0.0 1011 1023 348 0.7 7.9 Sunny all day
14 1.4 7.4 -0.1 80 98 8.3 10.4 0.6 5.6 20 1.5 37 0.7 1010 1022 157 0.6 1.6 Rain am, sunny ints pm
15 1.3 7.8 -1.5 74 96 7.8 10.2 -0.5 3.4 21 2.3 55 2.1 1008 1013 363 0.8 5.2 Sunny intervals all day
16 2.2 5.1 -0.2 74 97 7.3 10.0 -0.3 1.5 17 3.0 71 0.2 1008 1016 329 0.7 4.3 Sunny intervals all day
17 2.9 6.1 2.0 59 89 6.9 9.7 -1.7 1.6 27 5.7 136 0.0 1011 1017 127 0.6 0.0 Cloudy all day
18 1.6 5.7 0.5 68 96 6.5 9.7 0.2 2.4 30 7.9 190 15.7 994 1011 81 0.5 0.0 Rain & sleet am, rain pm
19 0.7 2.3 -0.4 87 96 6.6 9.5 -0.8 1.2 15 3.0 72 1.9 993 999 316 0.8 0.8 Brief sunny intervals all day
20 -0.7 0.9 -0.5 80 88 6.4 9.3 -3.2 -0.8 11 1.3 33 0.0 994 1000 87 0.0 0.0 Cloudy all day
21 -1.9 4.5 -4.5 77 97 6.0 9.2 -3.1 1.0 10 0.9 21 0.0 992 997 339 0.7 1.9 Sunny intervals all day
22 3.1 7.0 -3.5 90 98 5.8 9.1 -0.7 5.8 18 4.0 96 15.2 995 1001 79 0.5 0.0 Rain intermittent all day
23 0.9 2.3 0.4 94 98 5.9 8.9 0.5 2.1 16 1.6 39 17.6 1001 1007 91 0.0 0.0 Sleet/snow am, rain pm
24 1.1 6.1 -1.6 70 97 5.6 8.8 -0.5 2.1 9 1.2 26 1.7 1007 1020 391 0.9 8.1 Sunny all day
25 2.3 7.1 0.1 78 98 5.6 8.6 -0.4 6.7 31 5.7 135 3.3 1000 1020 89 0.5 0.0 Cloudy am, drizzle pm
26 3.1 10.2 -0.2 79 98 5.9 8.5 2.1 8.3 32 6.3 151 7.6 997 1013 343 1.0 5.2 Sunny am, cloudy pm
27 7.6 11.4 -1.2 61 98 6.5 8.4 1.8 10.8 30 8.2 196 6.2 993 1004 441 1.1 7.4 Sunny intervals all day
28 0.3 11.6 -3.1 81 99 6.7 8.5 -0.5 10.2 35 6.2 148 2.4 1002 1010 87 0.6 0.0 Cloudy all day
29 9.4 13.4 8.0 80 98 7.1 8.6 8.0 12.4 34 9.0 217 2.9 1003 1006 89 0.6 0.0 Cloudy all day
30 8.1 13.0 0.6 64 97 8.1 8.6 3.4 11.9 30 6.3 151 5.7 1001 1019 491 1.1 7.7 Sunny intervals all day
31 6.0 11.7 2.3 66 93 8.1 8.7 4.3 8.9 29 6.8 165 0.5 1012 1019 318 1.0 5.9 Sunny intervals all day
3.9 8.5 1.2 80 97 8 9.7 2.1 6.9 19 3.4 2519 112.1 1009 1018 207 0.6 67  

Graphs for January 2013

Figure 1. Temperature and Rainfall for January 2013.
Figure 2. Sunshine, UV Index and solar irradiance for January 2013.
Figure 3. Wind direction for January 2013.
Figure 4. Soil & Sea surface temperature for January 2013.
Figure 5. Mean wind speed, calm hours and air pressure for January 2013.