 |
 |
All about Soil Moisture |
 |
|
|
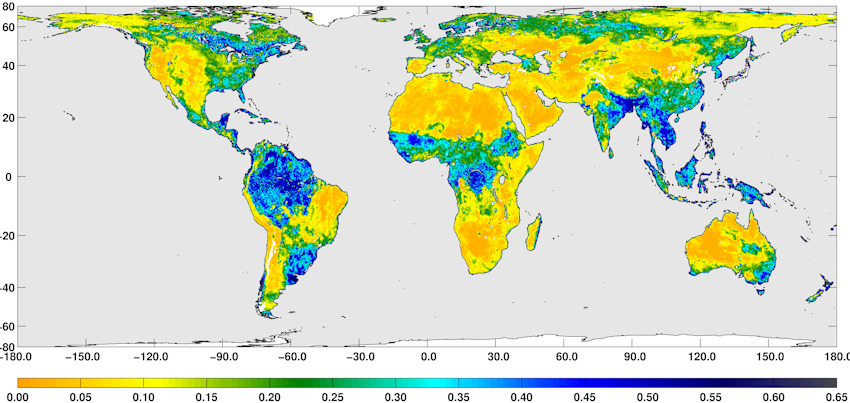
A three-day composite global map
of surface soil moisture between Aug. 25-27, 2015 |
|
Soil moisture
tension is measured by a Tensiometer or Electrical Resistance block and is
usually expressed in bars, centibars or kilopascals. One kilopascal is equal to
1 centibar; 100 centibars equals one bar. The graph depicts available soil
moisture on the y axis and a logarithmic scale of centibars on the x axis. The
curves for Loamy sand, Fine sand loam and Sandy loam appear similar to
logarithmic shapes. The curve for Clay appears similar to an exponential shape
and the curve for Loam begins as exponential but then changes to logarithmic
shape. With these instruments field capacity is always 0 to 10 centibars. The
trigger point (50% available moisture) in centibars for each soil texture is:
Loamy sand 25 cbar, Fine Sandy loam 30 cbar, Sandy loam 40 cbar, Loam 81 cbar,
Clay 205 cbar. |
|
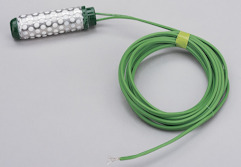
The Davis Soil
Moisture Sensor uses the gypsum block method and consists of two electrodes
embedded in a block of gypsum. They can be either cylindrical or rectangular in
shape with concentric or parallel electrodes (see image to the right). Wires are
joined onto each electrode and extruded from the gypsum block to measure the
resistance between the electrodes. The resistance between the two electrodes
varies with the water content in the gypsum block, which will depend directly on
the soil water tension. As the soil dries out water is extracted from the gypsum
block and the resistance between the electrodes increases. Conversely as the
soil wets, water is drawn back into the gypsum block and the resistance
decreases. |
 |
|
Davis soil
moisture probe |
|
A basic guide
to soil moisture readings
0-10 kPa
= Saturated soil
10-30 kPa
= Soil is adequately wet (except coarse sands, which are beginning to lose
water)
30-60 kPa
= Usual range for irrigation (most soils)
60-100 kPa
= Usual range for irrigation in heavy clay
100-200 kPa
= Soil is becoming dangerously dry.
|
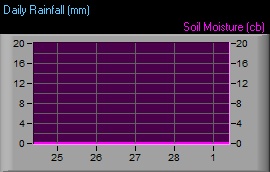 |
The Davis soil
moisture sensor uses electrical resistance to measure the moisture level of the
soil and does not require periodic maintenance. The sensor is buried directly
into the soil at a depth of 30 cm. The soils here at the Otter Valley Weather
Station are sandy-loam with the local geology being Triassic Sandstone. They are
prone to drying-out rapidly during dry spells in the spring and summer. The
graph to the left shows the most recent data regarding soil moisture at this
station. Rainfall has been included and a trend should emerge during
precipitation after lengthy dry spells where the soil moisture responds to
recent rainfall. During the winter the soil moisture generally reads less than
10 (saturated) but from mid-February onwards the soil starts to dry out and the
reading will begin to climb. |
|
Soil moisture readings for the
last 7 days |
|
The Davis Soil Moisture Sensor
measures soil water potential in the range from 0 to 200 centibars. In soil
drier than 50 centibars, plants must work hard to extract water and therefore
they can become stressed, especially non-drought resistant species. It is under
these conditions that irrigation should be applied.
Soil water potential, or soil
tension, is the amount of energy available in the soil for water movement. That
is, soil water potential is a measure of how much energy is required by the
plant to absorbed or extract water from the soil matrix. A soil water potential
value of 0 (zero) means the soil is saturated, or flooded, and there is free
movement of water. As soil water potential values become more negative, then the
greater amount of work is required by plants to extract water from the soil. A
value of -1,500 kPa (or 1,500 centibars) is called the permanent wilting point
and is the point where most plants can no longer extract moisture from the soil.
|
Wilting point, field capacity, and
available water capacity of various soil textures
|
Soil Texture |
Wilting Point |
Field Capacity |
Available water capacity |
| Water per
foot of soil depth |
Water per
foot of soil depth |
Water per
foot of soil depth |
| % |
in. |
% |
in. |
% |
in. |
| Medium
sand |
1.7 |
0.3 |
6.8 |
1.2 |
5.1 |
0.9 |
| Fine sand |
2.3 |
0.4 |
8.5 |
1.5 |
6.2 |
1.1 |
|
Sandy loam |
3.4 |
0.6 |
11.3 |
2.0 |
7.9 |
1.4 |
| Fine
sandy loam |
4.5 |
0.8 |
14.7 |
2.6 |
10.2 |
1.8 |
| Loam |
6.8 |
1.2 |
18.1 |
3.2 |
11.3 |
2.0 |
| Silt loam |
7.9 |
1.4 |
19.8 |
3.5 |
11.9 |
2.1 |
| Clay loam |
10.2 |
1.8 |
21.5 |
3.8 |
11.3 |
2.0 |
| Clay |
14.7 |
2.6 |
22.6 |
4.0 |
7.9 |
1.4 |
|
|
Soil water potential
should not be confused with soil water content. Soil water potential is an
absolute measurement, such as temperature, as it is a measure of a state of
energy. Soil water content, on the other hand, is a dependent measurement. Soil
water content depends on the physical properties of the soil. For example, a
soil water content value of 30% in a sandy soil means it is saturated, whereas
30% in a heavy clay soil may indicate that it is dry and there is little plant
available water. A soil water potential value of -33 kPa means the soil is at
field capacity whether it is measured in a sand or a heavy clay. |
|
|
|
Soil water potential is favoured by
some growers and scientific researchers because it is an absolute measurement.
If many sensors are installed across a field or research site where soil is
highly variable, then soil water potential measurements are far easier to
interpret than soil water content measurements. |
|
Home
|
Data
|
Live
|
Webcam
|
Station
|
Climate
|
Gallery
|
Contact
|
Links |
|
|
|
 |
|
 |
|